

Volume 4 - 3.0 Environmental Setting/Affected Environment
3.0 ENVIRONMENTAL SETTING/AFFECTED ENVIRONMENT
The proposed MSHCP Plan Area encompasses approximately 1.26 million acres (approximately 1,966 square miles) in western Riverside County, California. It includes all incorporated and unincorporated land west of the crest of the San Jacinto Mountains to the Orange County line. The proposed MSHCP is the largest HCP ever attempted and covers multiple species and multiple habitats within multiple jurisdictions. The proposed Plan Area covers a diverse landscape from urban cities to undeveloped foothills and montane forests, and stretches across the Santa Ana Mountains, Riverside Lowlands, San Jacinto Foothills, San Jacinto Mountains, Agua Tibia Mountains, Desert Transition, and San Bernardino Mountains bioregions.
The majority of western Riverside County is characterized by rural and suburban development intermixed with agricultural operations and large blocks of undeveloped lands. Large blocks of land along the south, east, and west boundaries of the proposed Plan Area consist of National Forest holdings. The natural topography can be described as a valley lowland area intersected with rolling hills surrounded by mountainous ranges. Lowland valley areas exist below 2,000 feet in elevation while scrub/chaparral dominated hillsides range from 2,000 to 3,000 feet in elevation. Mountainous areas within the proposed Plan Area range from 3,000 to over 10,000 feet above sea level.
3.1 Biological Resources
This section describes the biological setting in which the goal of assembling a 500,000 acre Conservation Area for conservation of up to 146 plant and wildlife species would be achieved.
3.1.1 Data Sources and Limitations
A comprehensive biological and physical database that includes information on vegetation, species occurrences, wetlands, topography, soils, and aerial photography is available for the proposed MSHCP Plan Area and was used in the development of the Plan. This section describes the various data layers used to develop the proposed MSHCP.
MSHCP Vegetation
The proposed MSHCP vegetation map is depicted in Figure 2.5 (in Section 2.0). This map was prepared by Pacific Southwest Biological Services (PSBS) and KTU+A in 1995. The methodology used to assemble the map is described in detail in the Western Riverside County Multi-Species Habitat Conservation Plan Phase I Information Collection and Evaluation Report (PSBS and KTU+A, February 1995). Data sources include aerial photography (1 inch = 2,000 feet, 1992-1993), existing generalized vegetation maps (CNDDB, Weislander Statewide Vegetation Survey, U.C. Santa Barbara Southern California Ecoregion "GAP" Analysis, 1991 Dangermond/RECON MSHCP Strategy Report). Methods used to create and interpret vegetation data include aerial photographs, edge matching, digitizing, and geographically registering the data. Areas of concern were ground-truthed. Vegetation types were classified according to Holland (1986).
The proposed MSHCP vegetation map represents conditions at the time the data were assembled, in this case 1991-1995; the current extent and character of vegetation communities may differ from that depicted on the proposed MSHCP vegetation map. Published and anecdotal data suggest that ecosystem state transition is occurring within some portions of the proposed Plan Area in particular, fire suppression has resulted in the conversion of frequently burned chaparral and coastal sage scrub to grassland, and also in shifts from Ponderosa pine and Jeffrey pine to incense cedar and white fir (Minnich, et al., 1995; Keeley, 1990; Zedler, et al., 1983). The proposed MSHCP incorporates features to update the vegetation map as new information is obtained, such as the development of a new vegetation map as part of the proposed MSHCP Monitoring Program. The timing and methodology for developing this map are described in Section 5.3 of Volume 1 of the proposed MSHCP.
This approach is compatible with the criteria-based format of the proposed MSHCP, which calls for assembly of 153,000 acres of additional reserve lands from within an approximately 300,000-acre Criteria Area. Reserve assembly will involve review of a variety of project-specific vegetation data to refine and guide the reserve assembly process. This criteria-based format differs somewhat from the large-scale NCCPs/HCPs for which a specific reserve boundary is delineated on a map at the time of permit issuance. With that type of approach, validation of the vegetation map at the landscape level may be more important than under the criteria-based approach selected for the proposed MSHCP.
The organizational structure established for the proposed MSHCP, as described in Section 6.6 of the proposed MSHCP, also provides opportunities to incorporate new information during the term of the proposed MSHCP permit.
Coastal Sage Scrub Habitat Quality Model
As part of the 1995 PSBS/KTU+A work referred to previously in the discussion of proposed MSHCP vegetation, PSBS and KTU+A modeled and evaluated variables potentially relevant to the suitability of coastal sage scrub habitat within the proposed Plan Area for the coastal California gnatcatcher. A detailed description of the methodology used to develop the model is presented in their report (PSBS and KTU+A, 1995). Variables used in the model include elevation, degree of slope, patch size, patch shape, proximity to other coastal sage scrub patches, and adjacent land use. The modeling designated the quality of coastal sage scrub in the proposed Plan Area and suitability for the gnatcatcher as very high, high, moderate, low, or very low. The primary limitations of the model with respect to proposed MSHCP planning are the age and quality of the database used to develop the model. In this regard, the model has the same limitations as the proposed MSHCP vegetation map.
MSHCP Species Occurrence Database
The University of California, Riverside (UCR) assembled a species occurrence database for use during the proposed MSHCP planning process. This database is accessible at http://ecoregion.ucr.edu/. The web site is a clearinghouse for biological information for the proposed MSHCP. Occurrence data were compiled from museum records, USFWS data, published and unpublished accounts, environmental impact reports, and field notes of local naturalists. As of August 2001, this database contained over 12,800 records.
The UCR species occurrence database incorporates accuracy and precision codes. For the proposed MSHCP species accounts included in Section B of the MSHCP Reference Document Volume II of the proposed MSHCP, validity of the various occurrence data is cited; less valid data are not used to draw conclusions regarding species conservation. For example, species locations that have low precision are not valid for defining conservation areas.
Herbarium Data Sources and Limitations
Additional occurrence/distribution data were gathered for particular plant species within the proposed MSHCP Plan Area from herbarium specimens at the San Diego Natural History Museum (SDNHM), Rancho Santa Ana Botanical Gardens (RSA) herbarium, and the UCR herbarium. Most of the occurrence and distribution data were downloaded from databases at SDNHM, RSA, and UCR. Additional data were hand-copied from herbarium specimens that had not been previously databased (e.g., the synoptic collection at RSA). The location data from each specimen were either copied or translated into one coordinate system to generate a point coverage depicting the spatial distribution of the sensitive plant species within the Plan Area. Approximately 800 data points were assembled with dates ranging from 1880 to 2001.
Precision codes were applied to individual occurrence records based on the quality and extent of both quantitative and qualitative geographic data using the precision code guide developed for the UCR species occurrence data.
Quantitative geographic data included species occurrences whose locations were reported as latitude and longitude in degrees, minutes, and seconds; as UTM coordinates in meters; or as locations described using township, range, and section designations. Species occurrences containing quantitative geographic data are considered to be the most valid.
Qualitative geographic data include species occurrences whose locations were reported as written descriptions. Species occurrences with only qualitative geographic data were generally given a lower precision rating, depending upon the quality of the specific information provided.
It is recognized that new data regarding species occurrences will become available during the proposed MSHCP implementation process including data assembled as part of the proposed MSHCP Monitoring Program described in Section 5.3 of the proposed MSHCP. The species-specific conservation objectives and the proposed MSHCP Management Plan contain measures to incorporate new occurrence data as they become available.
Wetlands
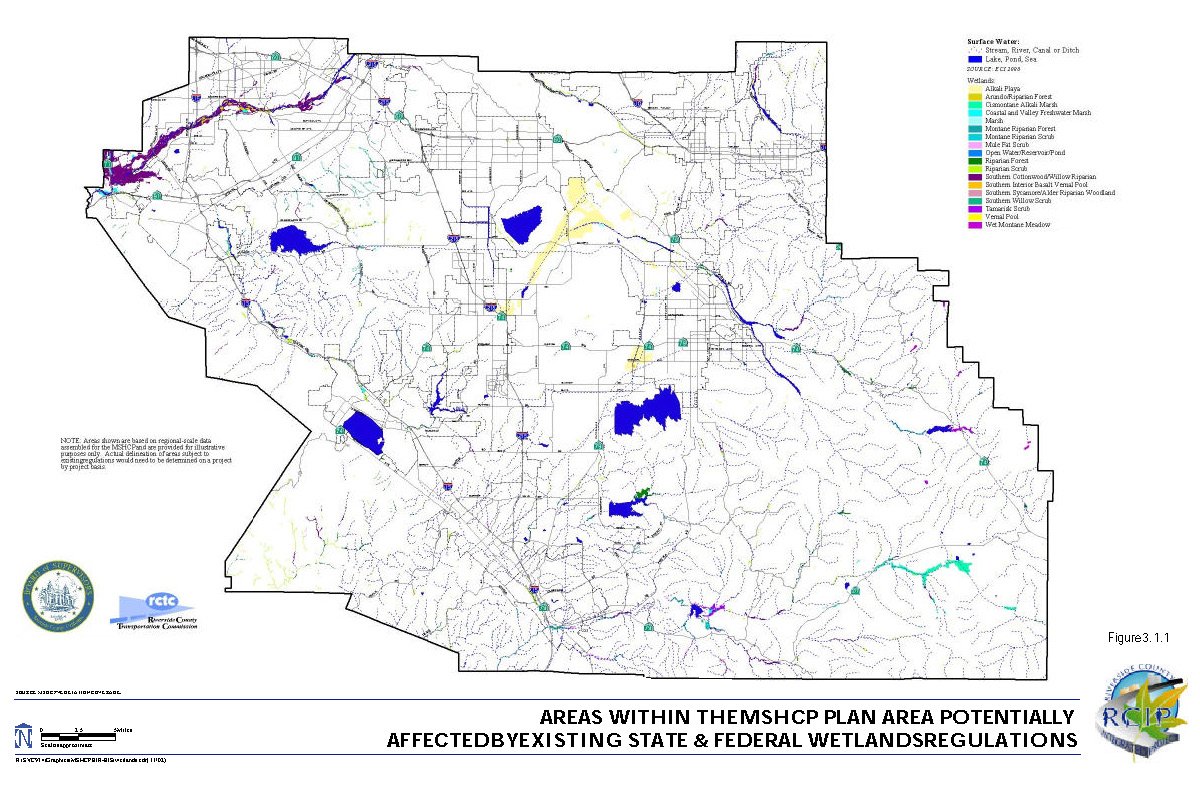
Wetlands information for the proposed Plan Area primarily is derived from the proposed MSHCP vegetation map. Other potential wetland areas, including streams, rivers, canals or ditches, ponds, and lakes, were mapped by Earth Consultants International (ECI) as part of the geologic hazards mapping assembled for the RCIP General Plan Update. A separate riparian GIS coverage was created by UCR research assistants in 2000 through aerial photo interpretation of 1996 digital orthophoto quarter quadrangles (DOQQs) of the Plan Area. Riparian areas were "heads up" digitized and categorized into four wetland habitat types based on dominant vegetation cover. All of these data were combined to create an exhibit depicting mapped wetland resources in the proposed Plan Area (Figure 3.1.1).
The wetlands map has the same limitations as the proposed MSHCP vegetation map, and those limitations are addressed in the proposed MSHCP in the same manner as those for the vegetation map. With respect to wetlands mapping, the U.S. Army Corps of Engineers (U.S. ACOE) is currently developing a functional assessment and programmatic wetlands delineation for the San Jacinto River and Upper Santa Margarita River Watersheds within the Plan Area as part of the U.S. ACOE Special Area Management Plan (SAMP) process currently underway for those watersheds.
A planning-level wetland delineation for the San Jacinto and Santa Margarita watersheds was recently completed, which was based on a modification of the standard delineation sampling protocols outlined in the U.S. ACOE Wetland Delineation Manual, color infrared image interpretation, and field verification visits. The delineation resulted in identification of 201 vegetation community types and development of a wetlands ratings system. Although this delineation produced a finer level of aquatic resource mapping, the U.S. ACOE wetlands map is limited in that it does not cover the entire MSHCP Plan Area.
Soils
The U.S. Department of Agriculture (USDA), Soil Conservation Service (SCS) (Knecht, 1971), and State Soil Geographic (STATSGO) database for California provided the generalized soils map that depicts 25 general soils types for the proposed Plan Area. In addition, the following soil types were digitized from 1973 SCS maps (at a scale of 1:15, 840 or 1 inch = 1,320 feet) and registered with digital Eagle Aerial images onscreen:
- Altamont clay (AaD, AaE2, AaF, Abf)
- Auld clay (AuC, AuD, AyF)
- Bosanko clay (BfC, BfD)
- Claypit
- Domino clay (Dt, Du, Dv, Dw)
- Porterville cobbly clay (PoC, PrD, PsC, PtB, PvD2)
- Traver (Tr2, Ts, Tp2, Tt2)
- Willows (Wg, Wh, Wm, Wn)
Soils were digitized in areas identified by DUDEK biologists to enable quantitative analysis of soils considered important for the conservation of certain plant species. Soils listed above were digitized for the following USGS quadrangles: Alberhill, Bachelor, El Casco, Elsinore, Hemet, Lake Mathews, Lakeview, Murrieta, Perris, Romoland, San Jacinto, Steele Peak, Sunnymead, Temecula, Wildomar, and Winchester.
A digital coverage for Delhi soils was also obtained from USFWS and used in the species analysis for the Delhi Sands flower-loving fly. The area currently identified as Delhi soils within the Plan Area may be updated based on site-specific mapping of Delhi soils by a qualified soil scientist within 3 years after a permit issuance.
Topography
USGS topography was used for proposed MSHCP planning process. In addition, specific elevation analyses were developed using a 500-meter interval coverage developed from a USGS 30-meter digital elevation model (DEM). A vegetation map with hill-shaded relief was also used.
The topographic database is not considered to be limited for purposes of landscape-level MSHCP planning. It is anticipated that newly flown, more accurate topography will be available for certain areas for evaluation of specific Covered Activities and other proposed MSHCP reserve assembly, management, and monitoring issues during the proposed MSHCP implementation process.
Aerial Photography
Aerial photographs were obtained from Eagle Aerial and include digital aerial images flown in fall 1999 for western Riverside County and flown on May 4, 2001, for the Temecula Valley (pixel size: 1 meter).
USGS DOQQs were obtained from USFWS and cover the majority of the proposed MSHCP Plan Area, with the exception of U.S. Forest Service (USFS) lands. The DOQQs were flown on September 30, 1996, false color infrared, 1-meter resolution.
The aerial photography database is not considered to be limited for purposes of landscape-level proposed MSHCP planning. It is anticipated that current aerial photography will be available throughout the long-term proposed MSHCP implementation process to permit evaluation of specific Covered Activities and other proposed MSHCP reserve assembly, management and monitoring issues as they arise.
Literature
A wide variety of literature was reviewed and used for the proposed MSHCP planning process. Literature citations for the species accounts are provided for each proposed MSHCP species in Section B of the MSHCP Reference Document, Volume II of the MSHCP. Other literature references are listed in Section D of the proposed MSHCP Reference Document, Volume II of the proposed MSHCP. It should be noted that a large body of scientific literature was made available by UCR. This literature was thoroughly reviewed but only specifically relevant literature was cited as appropriate. For example, many of the species references contained little or no relevant information for conservation planning in the proposed Plan Area.
3.1.2 Bioregions
The review of databases and literature shows that the exiting vegetation database for the Plan Area does not adequately reflect the considerable variety of plant and animal species in western Riverside County. Grinnell (1933) described biotic or "life" zones for Southern California, but the scale of these life zones is generally too coarse to be useful for analyzing potential biotic variation within the proposed Plan Area. To address this limitation and better depict potential variation within and among species, a biogeographical map (referred to here simply as bioregions) was created to help describe diversity of habitats on a regional scale within the proposed Plan Area. This was done under the assumption that regional diversity in conserved areas translates directly into biological and genetic diversity. By ensuring regional representation of species and redundancy of resources, there is some buffer against the effects of natural and anthropogenic catastrophic events, such as wildfires, floods, and disease, on conserved areas.
Using existing information on soils (SCS), elevation (30-meter DEM data), topography (hill-shaded DEM mapping), and local expertise, a draft map that roughly demarcates the general bioregions within the proposed MSHCP Plan Area was drawn. Existing levels of human disturbance (urbanization, intensive agriculture, grazing, etc.) were considered because they have had a substantial effect on the current biota of the proposed Plan Area. While discrete bioregion boundaries cannot capture the natural continuum or gradient of environmental changes and transitions within the proposed Plan Area, these boundaries roughly represent areas where species turnover and habitat zone transitions are pronounced in relation to changes in landform and other environmental features. Because continuous climatic maps showing precipitation and air temperature (maxima, minimi, means) were not available, landform and elevation were used as surrogates for these variables to draw the initial map. DUDEK staff and subconsultants knowledgeable about the distribution of plant and animal species in western Riverside County then fine-tuned the boundaries where elevation and landforms did not accurately reflect changes in species and habitat distributions. This methodology is similar to the approach used to develop bioregions for San Diego County (T. Oberbauer, personal communication, 2000). The validity of these bioregions was initially tested by examining the distribution of vegetation types and sensitive species that fall within them. On the basis of existing data, it was determined that the bioregions appear to reflect the different suites of species and vegetation communities in the proposed Plan Area. As a work in progress, these boundaries are subject to change based on further analyses, scientific study, and input from experts familiar with western Riverside County.
Seven distinct bioregions were identified: Santa Ana Mountains, Riverside Lowlands, San Jacinto Foothills, Agua Tibia Mountains, Desert Transition, San Bernardino Mountains, and San Jacinto Mountains (Figure 2.4). The characteristic features of each bioregion are described below.
Santa Ana Mountains Bioregion
The Santa Ana Mountains Bioregion extends south of State Route 91 (SR-91) to the Riverside/San Diego County line and occurs west of Interstate 15 (I-15). It encompasses the Cleveland National Forest and areas north of the Santa Margarita River. This bioregion generally occurs at elevations above 2,000 feet and supports Diegan coastal sage scrub, mesic chaparral, and sparse coniferous vegetation. The Santa Ana Mountains Bioregion is heavily influenced by coastal climate factors such as fog, rainfall, and wind. This bioregion is relatively undisturbed and not urbanized.
Riverside Lowlands Bioregion
The Riverside Lowlands Bioregion characterizes areas east of the Santa Ana Mountains Bioregion, south of the Riverside/San Bernardino County line, west of Diamond Valley Lake, Lake Skinner, and Gilman Hot Springs, and north of the Riverside/San Diego County line. This bioregion encompasses Estelle Mountain, Lake Mathews, Reche Canyon/Badlands, the San Jacinto Valley, Gavilan Hills, Lakeview Mountains, and French Valley. The Riverside Lowlands Bioregion generally occurs at elevations below 2,000 feet and is characterized by Riversidean sage scrub and annual grasslands. The relatively arid climate is in part the result of the rain shadow effect cast by the Santa Ana Mountains. A high level of disturbance and urbanization is noted within this bioregion.
San Jacinto Foothills Bioregion
The San Jacinto Foothills Bioregion generally includes areas north of SR-79, east of the Riverside Lowlands Bioregion and west of the San Jacinto Mountains Bioregion. This bioregion encompasses Vail Lake, Sage, and Cactus Valley. The San Jacinto Foothills Bioregion occurs at elevations of 2,000 to 3,000 feet and is dominated by Riversidean sage scrub and xeric chaparral associations. This bioregion receives less frequent frost and snow than the mountainous areas. This bioregion has not been heavily disturbed or urbanized.
Agua Tibia Mountains Bioregion
The Agua Tibia Mountains Bioregion extends south from SR-79 to the Riverside/San Diego County line. It encompasses the Agua Tibia Mountains and generally occurs at elevations above 2,000 feet. This bioregion supports Diegan coastal sage scrub, mesic chaparral, and sparse coniferous vegetation. The Agua Tibia Mountains Bioregion has not been heavily disturbed or urbanized.
Desert Transition Bioregion
The Desert Transition Bioregion is located in the southeastern portion of the proposed Plan Area and encompasses the Cahuilla Indian Reservation and Lake Riverside area. The Desert Transition Bioregion generally occurs at elevations above 3,000 feet and is arid and desert-influenced. This bioregion supports red shank chaparral, big basin sage scrub, and semidesert succulent scrub habitats. This bioregion has not been heavily disturbed or urbanized.
San Bernardino Mountains Bioregion
The San Bernardino Mountains Bioregion is located in the northwestern portion of the proposed Plan Area and encompasses areas north of I-10 within the Calimesa, Beaumont, and Banning area; it generally occurs at elevations above 3,000 feet. This bioregion supports coniferous forests, montane chaparral, and broad-leaved forest. The San Bernardino Mountains Bioregion is floristically distinct from the San Jacinto Mountains Bioregion. This bioregion has not been heavily disturbed or urbanized.
San Jacinto Mountains Bioregion
The San Jacinto Mountains Bioregion occurs in the eastern portion of the proposed Plan Area and encompasses the San Bernardino National Forest, Pine Cove, Idyllwild, and upper San Jacinto River and Bautista Canyon Creek. This bioregion supports coniferous forests, montane chaparral, and broad-leaved forest; it generally occurs at elevations above 3,000 feet. The San Jacinto Mountains Bioregion is floristically distinct from the San Bernardino Mountains Bioregion.
3.1.3 Vegetation Communities
The proposed MSHCP vegetation communities map was created in 1995 by PSBS and mapped by KTU+A. For the purpose of analysis, the 1995 vegetation communities were subsequently generalized to ensure consistency in mapping scale across the proposed Plan Area. In addition to the vegetation communities map, PSBS and KTU+A created a coastal sage scrub habitat quality map for the purpose of regional reserve planning for the California gnatcatcher. Other vegetation mapping efforts include a riparian map coverage created by UCR in 2000. The proposed MSHCP vegetation map described above incorporates 50 vegetation community classifications. For the purpose of proposed MSHCP planning and analysis, the 50 classifications were collapsed to 14; both classes of categories are summarized in Table 3A.
| Table 3A - Summary of Collapsed and Uncollapsed Vegetation Communities Classifications | ||
|---|---|---|
| Collapsed Vegetation Communities Classifications | Uncollapsed Vegetation Communities Classifications | |
| Montane Coniferous Forest | Jeffrey Pine | |
| Lodgepole Pine | ||
| Lower Montane Coniferous Forest | ||
| Mixed Evergreen Forest | ||
| Southern California White Fir | ||
| Subalpine Coniferous | ||
| Woodland and Forests | Black Oak Forest | |
| Broadleaved Upland Forest | ||
| Coast Live Oak Woodland | ||
| Dense Engelmann Oak Woodland | ||
| Oak Woodland | ||
| Peninsular Juniper Woodland and Scrub | ||
| Coastal Sage Scrub | Coastal Scrub | |
| Diegan Coastal Sage Scrub | ||
| Riversidean Sage Scrub | ||
| Riversidean Alluvial Fan Sage Scrub | Disturbed Alluvial | |
| Riversidean Alluvial Fan Sage Scrub | ||
| Desert Scrub | Big Sagebrush Scrub | |
| Colorado Desert Wash Scrub | ||
| Semidesert Succulent Scrub | ||
| Sonoran Desert Scrub | ||
| Chaparral | Chamise Chaparral | |
| Chaparral | ||
| Red Shank Chaparral | ||
| Semi-Desert | ||
| Playas and Vernal Pools | Alkali Playa | |
| Southern Interior Basatt Vernal Pool | ||
| Vernal Pool | ||
| Grassland | Non-native Grassland | |
| Valley and Foothill Grassland | ||
| Riparian Scrub, Woodland, Forest | Arundo/Riparian Forest | |
| Montane Riparian Forest | ||
| Montane Riparian Scrub | ||
| Mule Fat Scrub | ||
| Riparian Forest | ||
| Riparian Scrub | ||
| Southern Cottonwood/Willow Riparian | ||
| Southern Sycamore/Alder Riparian Woodland | ||
| Southern Willow Scrub | ||
| Tamarisk Scrub | ||
| Meadows and Marshes | Meadow (Montane) | |
| Wet Montane Meadow | ||
| Coastal and Valley Freshwater Marsh Marsh |
||
| Cismontane Alkali Marsh | Cismontane Alkali Marsh | |
| Water | Open Water/Reservoir/Pond | |
| Developed or Disturbed Land | Residential/Urban/Exotic | |
| Agriculture | Dairy and Livestock Feed Yards | |
| Field Croplands | ||
| Grove/Orchard | ||
The proposed MSHCP Plan Area encompasses approximately 1.26 million acres with approximately 871,000 acres (69 percent) supporting natural vegetation. The 14 vegetation communities within the proposed Plan Area (Table 3B) include chaparral (434,950 acres), cismontane alkali marsh (1,260 acres), coastal (Diegan and Riversidean) sage scrub (156,450 acres), desert scrubs (14,570 acres), native and non-native grassland (154,140 acres), meadows and marshes (1,020 acres), montane coniferous forest (29,910 acres), peninsular juniper woodland and scrub (1,080 acres), playas and vernal pools (7,910 acres), riparian scrub/woodland/forests (15,030 acres), Riversidean alluvial fan sage scrub (7,940 acres), open water (12,210 acres), woodlands and forests (34,300 acres), and unknown (1,350 acres). In addition, approximately 169,480 acres are in agriculture, and the remaining 218,260 acres are considered disturbed or developed land. Section C of the proposed MSHCP Reference Document, in Volume II of the proposed MSHCP, contains detailed habitat accounts describing the biogeography, range and distribution, vegetation characteristics, species composition, physical environment, ecosystem processes, community relationships, and threats for each vegetation community within the proposed Plan Area. A brief description of each vegetation community is provided below.
| Table 3B - Acreage and Proportional Distribution of Vegetation Communities within the Proposed MSHCP Plan Area | ||
|---|---|---|
| Vegetation Type | Total Acres in Plan Area | Percent of Total Vegetation |
| Agriculture | 169,480 | 13.5% |
| Chaparral | 434,950 | 35.0% |
| Cismontane Alkali Marsh | 1,260 | 0.1% |
| Coastal Sage Scrub | 156,450 | 12.0% |
| Desert Scrub | 14,570 | 1.2% |
| Grassland | 154,140 | 12.2% |
| Meadows and Marshes | 1,020 | 0.08% |
| Montane Coniferous Forest | 29,910 | 2.4% |
| Playas and Vernal Pools | 7,910 | 0.6% |
| Riparian Scrub, Woodland, and Forest | 15,030 | 1.2% |
| Riversidean Alluvial Fan Sage Scrub | 7,940 | 0.6% |
| Water | 12,210 | 1.0% |
| Woodlands and Forests | 34,300 | 2.7% |
| Developed or Disturbed Land | 218,260 | 17.3% |
| Unknown | 1,350 | 0.11% |
| TOTALS | 1,258,750 | 100% |
Agriculture
Agricultural lands include areas occupied by dairies and livestock feed yards or areas that have been tilled for use as croplands or groves/orchards. Approximately 13 percent of the MSHCP Plan Area (169,480 acres) consists of agricultural lands. The largest areas of dairy and livestock feed yards are located north of San Jacinto and north of Juniper Flats in the communities of Lakeview, Mystic Lake, Nuevo, southeast Perris, Eastvale, Lake Norconian off Bellegrave Avenue, Norco, and in Glen Avon. Field croplands are mapped extensively throughout the proposed Plan Area. The largest areas are around the following: State Route 371 (SR-371) in the vicinity of Anza; in an eastwest strip from Murrieta Hot Springs, through French Valley; Antelope Valley, Paloma Valley, Menifee Valley, Winchester, and Domenigoni Valley to West Hemet; the Diamond Valley area; and in Eastvale. The largest area of grove/orchard is in Santa Rosa East between Gavilan Mountain and Mesa de Colorado. Agricultural lands are further discussed in Sections 3.2 and 4.2.
Chaparral
Chaparral vegetation is the most abundant and widespread vegetation type in western Riverside County, covering approximately 35 percent (434,950 acres) of the proposed Plan Area. Large contiguous stands of chaparral occur along the Santa Ana Mountains in the western portion of the proposed Plan Area, and along the San Bernardino, San Jacinto, and Agua Tibia Mountains in the eastern and southern portions. Although chaparral is less common than other vegetation types in the central lowlands of Riverside County, three large chaparral-dominated areas occur on steeper lands near the Gavilan Hills-Gavilan Plateau-Meadowbrook Region, the Lakeview Mountains-Double Butte area, and the Sedco Hills-Hogbacks area.
Chaparral is a shrub-dominated vegetation community that is composed largely of evergreen species that range from 3 to 12 feet in height (Keeley, 2000). The most common and widespread species within chaparral is chamise (Adenostoma fasciculatum) (Hanes, 1971). Other common shrub species include manzanita (Arctostaphylos spp.), wild-lilac (Ceanothus spp.), oak (Quercus spp.), redberry (Rhamnus spp.), laurel sumac (Malosma laurina), mountain-mahogany (Cercocarpus betuloides), toyon (Heteromeles arbutifolia), and mission manzanita (Xylococcus bicolor) (Holland, 1986). Soft-leaved subshrubs are less common in chaparral than in coastal sage scrub (see below) but occur within canopy gaps of mature stands (Holland, 1986; Keeley and Keeley, 1988; Sawyer and Keeler-Wolf, 1995). Common species include California buckwheat (Eriogonum fasciculatum), sages (Salvia spp.), California sagebrush (Artemisia californica), and monkeyflower (Mimulus spp.). In addition, herbaceous species, including deerweed (Lotus scoparius), nightshade (Solanum spp.), Spanish bayonet (Yucca whipplei), rock-rose (Helianthemum scoparium), onion (Allium spp.), soap plant (Chlorogalum spp.), bunch grasses (Nassella spp., and Melica spp.), wild cucumber (Marah spp.), bedstraw (Galium spp.), and lupine (Lupinus spp.) are also present (Holland, 1986; Keeley and Keeley, 1988; Sawyer and Keeler-Wolf, 1995 ).
Cismontane Alkali Marsh
Cismontane alkali marsh habitat is scattered sparsely over the western Riverside County region, occupying approximately 0.1 percent (1,260 acres) of the proposed Plan Area. Cismontane alkali marsh was mapped in two general localities along Cahuilla Creek south of Anza and upstream from Lake Mathews along the Colorado River aqueduct.
Typical cismontane alkali marsh species include yerba mansa (Anemopsis californica), saltgrass (Distichlis spicata), alkali-heath (Frankenia salina), cattails (Typha spp.), common pickleweed (Salicornia virginica), rushes (Juncus spp.), marsh flea-bane (Pluchea odorata), and sedges (Carex spp.) (Holland, 1986).
Coastal Sage Scrub
Coastal sage scrub is distributed throughout western Riverside County, occupying approximately 12 percent (156,450 acres) of the proposed Plan Area (PSBS, 1995). It occurs from the eastern slopes of the Santa Ana Mountains to elevations in the San Jacinto Mountains less than 5,000 feet. Sage scrub often is distributed in patches throughout its range. Over a scale of several miles, it can be found in diverse vegetation community mosaics with other plant communities, particularly grassland and chaparral, and oak/riparian woodland in wetter areas. In western Riverside County, coastal sage scrub is found both in large contiguous blocks scattered throughout the County as well as integrated with chaparral and grasslands.
Coastal sage scrub is dominated by a characteristic suite of low-statured, aromatic, drought-deciduous shrubs, and subshrub species. Composition varies substantially depending on physical circumstances and the successional status of the vegetation community; however, characteristic species include California sagebrush, California buckwheat, laurel sumac, California encelia (Encelia californica), and several species of sage (e.g., Salvia mellifera, S. apiana) (Holland, 1986; Sawyer-Wolf, 1995). Other common species include brittlebush (Encelia farinosa), lemonadeberry (Rhus integrifolia), sugarbush (Rhus ovata), yellow bush penstemon (Keckiella antirrhinoides), Mexican elderberry (Sambucus mexicana), sweetbush (Bebbia juncea), boxthorn (Lycium spp.), shore cactus (Opuntia littoralis), coastal cholla (Opuntia prolifera), tall prickly-pear (Opuntia oricola), and species of Dudleya.
Desert Scrub
Desert scrub, including big sagebrush scrub and Sonoran desert scrub, occurs mostly in the southeastern portion of the proposed Plan Area. Desert scrub occupies approximately 1.2 percent (14,570 acres) of the proposed Plan Area. Large acreages of the vegetation community occur north and south of SR-371 within Tule Valley, Culp Valley, Wilson Creek, Cahuilla, the Ramona Indian Reservation, the Community of Anza, and east of Aguanga and Lake Riverside.
Desert scrub is typically composed of shrubs such as big sagebrush (Artemisia tridentata), bitterbrush (Purshia tridentata), rubber rabbit-bush (Chrysothamus nauseosus), yellow rabbitbrush (Chrysothamus viscidiflorus), black bush (Coleogyne ramosissima), Mormon-tea (Ephedra viridis), horsebrush (Tetradymia canescens), plateau gooseberry (Ribes velutinum), hopsage (Grayia spinosa), burro weed (Ambrosia dumosa), brittlebush, crucifixion-thorn (Canotia holacantha), ocotillo (Fouquieria splendens), and creosote scrub (Larrea tridentata) (Holland, 1986). The herbaceous cover generally is dominated by a mixture of perennial bunch grasses, such as ricegrass (Achnatherum hymenoides), needle-and-thread (Stipa comata), letterman’s needlegrass (Stipa lettermanii), needlegrass (Stipa occidentalis and Stipa thurberiana), desert needlegrass (Stipa speciosa), one-sided bluegrass (Poa secunda), bluebunch wheatgrass (Agropyron spicata), and Great Basin wild rye (Leymus cinereus). Annual grasses and forbs may also occur within big sagebrush scrub. Cheatgrass (Bromus tectorum), an introduced annual grass, has become the dominant herbaceous species in many areas.
Grasslands
Grasslands occur throughout most of western Riverside County and cover approximately 12.2 percent (154,130 acres) of the proposed Plan Area. Two general types of grasslands occur in Southern California: (1) non-native dominated, primarily annual grassland (“non-native grassland”); and (2) native dominated, perennial grassland (“valley and foothill grassland”) (Heady, 1977; Keeley, 1989; Sims and Risser, 2000). The only valley and foothill grasslands mapped within the proposed Plan Area are distributed over approximately 0.2 percent (2,700 acres) of the proposed Plan Area on the Santa Rosa Plateau. Non-native grasslands occur throughout the majority of the proposed Plan Area (11.6 percent), usually within close proximity to urbanized or agricultural land uses. Large patches of non-native grasslands occur in the Riverside Lowlands near March Air Reserve Base (ARB), Lake Mathews, Lake Perris, Lake Elsinore, near Banning, Cahuilla, and in the Terwilliger Valley south of Anza.
Valley and foothill grasslands typically contain the perennial bunch grasses Nassella pulchra and Nassella lepida. Lesser amounts of other native grasses, such as Melica spp., Leymus spp., Muhlenbergia spp., and beard grass (Bothriochloa barbinodis), may also be present. In addition, non-native grasses or forbs may be present to varying degrees. Native herbaceous plants commonly found within valley and foothill grasslands include yellow fiddleneck (Amsinckia menziesii), common calyptridium (Calyptridium monardum), suncup (Camissonia spp.), Chinese houses (Collinsia heterophylla), California poppy (Eschcholzia californica), tarweed (Hemizonia spp.),
coast goldfields (Lasthenia californica), common tidy-tips (Layia platyglossa), Lupinus spp., Plagiobothrys spp., blue dicks (Dichelostemma capitata), Muilla spp., blue-eyed grass (Sisyrinchium bellum), and Dudleya spp. (Holland, 1986; Keeley, 1989; Sims and Risser, 2000).
Non-native grasslands are likely to be dominated by several species of grasses that have evolved to persist in concert with human agricultural practices: slender oat (Avena barbata), wild oat (Avena fatua), fox tail chess (Bromus madritensis), soft chess (Bromus hordeaceus), ripgut grass (Bromus diandrus), barley (Hordeum spp.), rye grass (Lolium multiflorum), English ryegrass (Lolium perrene), rat-tail fescue (Vulpia myuros), and Mediterranean schismus (Schismus barbatus) (Jackson, 1985; Sims and Risser, 2000).
Meadows and Marshes
Approximately 1,020 acres of meadow and marsh vegetation communities, including coastal and valley freshwater marsh, undifferentiated marsh, and wet montane meadow, exist within the proposed Plan Area, comprising 0.04 percent of the proposed Plan Area. Occurrences of this vegetation community have been mapped in the Prado Basin in the Santa Ana River Valley, on the Santa Ana River near Pedley, north of Lake Elsinore in Walker Canyon, near San Jacinto, along the shores of Lake Skinner and Vail Lake, and adjacent to the cismontane alkali marsh on Cahuilla Creek. Undifferentiated marsh was mapped in three locations, including the shore of Lake Mathews, near Mystic Lake, and upstream from Vail Lake along Temecula Creek in the Aguanga Valley. Wet montane meadow was mapped in the San Jacinto Mountains in the San Bernardino National Forest, primarily within the vicinity of Hemet Lake.
Meadow and marsh vegetation communities occur in both flowing and still water. This vegetation community includes cattails, bulrushes, sedges, spike rushes, flatsedges (Cyperus spp.), smartweed (Polygonum spp.), watercress (Rorippa spp.), yerba mansa, and also contains perennial and biennial herbs (e.g., Oenothera spp., Polygonum spp., Lupinus spp., Potentilla spp., and Sidalcea spp.) and grasses (e.g. Agrostis spp., Deschampsia spp., and Muhlenbergia spp.) (Barbour and Major, 1977; Sawyer and Keeler-Wolf, 1995; Stephenson and Calcarone, 1999; Holland and Keil, 1995). Rooted aquatic plant species with floating stems and leaves also may be present, such as pennywort (Hydrocotyle spp.), water smartweed (Polygonum amphibium), pondweeds (Potamogeton spp.), and water-parsley (Oenanthe sarmentosa). Wet montane meadows that dry out by mid-summer have a higher percentage of perennial grasses than meadows that remain moist during the entire growing season (Holland and Keil 1995).
Montane Coniferous Forest
Montane coniferous forest, including Jeffrey pine, lodgepole pine forest, lower montane coniferous forest, mixed evergreen forest, Southern California white fir forest, and subalpine coniferous forest, occupies 2.4 percent (29,900 acres) of the proposed MSHCP Plan Area. It occurs within the San Jacinto Mountains, Agua Tibia, Cleveland National Forest, and Santa Rosa Mountains.
Montane coniferous forest is dominated by Jeffrey pine (Pinus jeffreyi), ponderosa pine (Pinus ponderosa), Coulter pine (Pinus coulteri), lodgepole pine (Pinus contorta ssp. murrayanna), limber pine (Pinus flexilis), bigcone Douglas-fir (Pseudotsuga macrocarpa), Pacific madrone (Arbutus menziesii), bigleaf maple (Acer macrophyllum), Rocky Mountain white fir (Abies concolor var. concolor), and sugar pine (Pinus lambertiana). Common understory shrubs include manzanita, California lilac (Ceanothus spp.), chinquapin (Chrysolepis), currant (Ribes spp.), and dwarf mistletoe (Arceuthobium campylopodum). The herbaceous layer is composed of morning-glory (Calystegia occidentalis ssp. fulcrata), sedge (Carex multicaulis), clarkia (Clarkia rhomboidea), and mountain-heather (Phyllodoce breweri).
Playas and Vernal Pools
These vegetation communities comprise 0.6 percent (7,910 acres) of the proposed Plan Area. Playas and vernal pools are found in western Riverside County in the San Jacinto Valley/Perris Basin and on the Santa Rosa Plateau.
Vernal pools are ephemeral wetlands that form in shallow depressions underlain by a substrate near the surface that restricts the downward percolation of water. Depressions in the landscape fill with rainwater and runoff from adjacent areas during the winter and may remain inundated until spring or early summer, sometimes drying more than once during the wet season. Smaller pools can fill and dry, and larger pools can hold water longer and may in the deeper portions support species that are more representative of freshwater marshes. Vernal pools are well-known for their high level of endemism (Stone, 1989) and abundance of rare, threatened, or endangered species (Sawyer and Keeler-Wolf, 1995). Many vernal pools are characterized by concentric rings of plants that flower sequentially as the pools dry. Vernal pools are dominated by native annual plants, with low to moderate levels of perennial herbaceous cover. Common vernal pool plant species in western Riverside County include woolly marbles (Psilocarphus brevissimus), toad rush (Juncus bufonius), and spike rush. In addition, the following sensitive or listed plant species are found in one or more of these pools: California Orcutt grass (Orcuttia californica), Coulter’s goldfields (Lasthenia glabrata ssp. coulteri), little mousetail (Myosurus minimus ssp. apus), spreading navarretia (Navarretia fossalis), low navarretia (Navarretia prostrata), Orcutt’s brodiaea (Brodiaea orcuttii), thread-leaved brodiaea (Brodiaea filifolia), Parish’s brittlescale (Atriplex parishii), Parish’s meadowfoam (Limnanthes gracilis ssp. parishii), San Diego button-celery (Eryngium aristulatum var. parishii), Wright’s trichocoronis (Trichocoronis wrightii var. wrightii), San Jacinto Valley crownscale (Atriplex coronata var. notatior), and smooth tarplant (Centromadia pungens ssp. laevis) (Sawyer and Keeler-Wolf, 1995). The Santa Rosa Plateau fairy shrimp (Linderiella santarosae) only occurs in western Riverside county, which is also the location of the southernmost record for the vernal pool fairy shrimp (Branchinecta lynchi) (Eriksen and Belk, 1999).
Riparian Forest, Woodland, and Scrub
Riparian vegetation, including forest, woodland, and scrub subtypes, is distributed in waterways and drainages throughout much of western Riverside County, covering approximately 1.2 percent (15,030 acres) of the proposed Plan Area. Southern cottonwood/willow forest makes up the largest proportion of the riparian vegetation in the proposed Plan Area, comprising nearly one-half (6,610 acres) of the acreage. Most of the southern cottonwood/willow forest vegetation community occurs along the Santa Ana River drainage from Lake Evans to beyond the Prado basin, along the San Gorgonio River north of Banning and along Temecula Creek east of Vail Lake. Additional types of riparian vegetation can be found along the San Gorgonio River north of Banning (montane riparian forest), Temescal Canyon Wash and its tributaries (riparian scrub and mule fat scrub), the stream channels within the San Mateo Canyon watershed (riparian Riparian communities typically consist of one or more deciduous tree species with an assorted understory of shrubs and herbs (Holland and Keil, 1995). Depending on community type, a riparian community may be dominated by any of several trees/shrubs, including box elder (Acer negundo), bigleaf maple, coast live oak (Quercus agrifolia), white alder (Alnus rhombifolia), sycamore (Platanus racemosa), Fremont’s cottonwood (Populus fremontii), California walnut (Juglans californica), Mexican elderberry, wild grape (Vitis girdiana), giant reed (Arundo donax), mule fat (Baccharis salicifolia), tamarisk (Tamarix spp.), or any of several species of willow (Salix spp.). In addition, various understory herbs may be present, such as saltgrass, wild cucumber (Marah macrocarpus), mugwort (Artemisia douglasiana), stinging nettle (Urtica dioica), and poison oak (Toxicodendron diversilobum).
Riversidean Alluvial Fan Sage Scrub
Riversidean alluvial fan sage scrub occurs throughout many drainages in the proposed Plan Area and comprises approximately 0.6 percent (7,940 acres) of the proposed Plan Area. Large acreages of the vegetation occur in the following areas: on the Santa Ana River near Lake Evans in the City of Riverside; along the San Gorgonio River and tributaries near Banning; on the San Jacinto River from the National Forest to the Soboba Indian Reservation; near Temecula along Temecula Creek; the Aguanga area; Bautista Creek south of Hemet; and near Murrieta and Glen Ivy in the Temescal Valley.
Riversidean alluvial fan sage scrub is a Mediterranean shrubland type that occurs in washes and on gently sloping alluvial fans. Alluvial scrub is made up predominantly of drought-deciduous soft-leaved shrubs, but with significant cover of larger perennial species typically found in chaparral (Kirkpatrick and Hutchinson, 1977). Scalebroom (Lepidospartum squamatum) generally is regarded as an indicator of Riversidean alluvial scrub (Smith, 1980; Hanes, et al., 1989). In addition to scalebroom, alluvial scrub typically is composed of white sage (Salvia apiana), redberry (Rhamnus crocea), California buckwheat, Spanish bayonet, California croton (Croton californicus), cholla (Opuntia spp.), tarragon (Artemisia dracunculus), yerba santa (Eriodictyon spp.), mule fat, and mountain-mahogany (Hanes, et al., 1989; Smith, 1980). Annual species composition has not been studied but is probably similar to that found in understories of neighboring shrubland vegetation. Two sensitive annual species are endemic to alluvial scrub vegetation in the proposed Plan Area: slender-horned spineflower (Dodecahema leptocerus) and Santa Ana River woollystar (Eriastrum densifolium ssp. sanctorum).
Water
Approximately 1.0 percent (12,210 acres) of the proposed Plan Area consists of open water habitat. Open water was mapped at Vail Lake, Lake Skinner, Diamond Valley Lake, Lake Perris, Mystic Lake, Canyon Lake, Lake Elsinore, Lee Lake, Lake Mathews, Hemet Lake, portions of the San Jacinto River, and portions of the Santa Ana River, as well as various small ponds, private reservoirs, and portions of stream channels.
Open water habitat typically is unvegetated due to a lack of light penetration. However, open water may contain suspended organisms such as filamentous green algae, phytoplankton (including diatoms), and desmids (Grenfell, 1988). Floating plants such as duckweed (Lemna spp.), water buttercup (Ranunculus aquatilis), and mosquito fern (Azolla filiculoides) also may be present (Holland and Keil, 1995). Open water includes inland depressions, ponds, lakes, reservoirs, and stream channels containing standing water and often occur in conjunction with riparian and upland vegetation communities. Depth may vary from hundreds of feet to a few inches.
Woodlands and Forests
The proposed Plan Area supports approximately 34,300 acres (2.7 percent of the proposed Plan Area) of woodlands and forests composed of black oak forest, broad-leaved upland forest, oak woodland, and peninsular juniper woodland vegetation communities. Woodland and forest vegetation communities are dominated by Englemann oak (Quercus englemannii), coast live oak, canyon live oak (Quercus chrysolepis), interior live oak (Quercus wislizenii), and black oak (Quercus kelloggii) in the canopy, which may be continuous to intermittent or savannah-like. Four-needle pinyon (Pinyon quadrifolia), single-leaf pinyon pine (Pinus monophylla) and California juniper (juniperus californica) are the canopy species of peninsular juniper woodland, which most commonly occurs in Southern California, forming a scattered canopy from 9 to 45 feet tall (Sawyer and Keeler-Wolf 1995; Holland and Keil 1995).
Many understory plants in oak woodlands are shade tolerant and include wild blackberry (Rubus ursinus), snowberry (Symphoricarpos mollis), California walnut, California-lilac (ceanothus spp.), Rhus spp., currant, toyon, California bay (Umbellularia californica), Engelmann oak, manzanita (Arctostaphylos spp.), laurel sumac, poison oak, and herbaceous plants including bracken fern (Pteridium aquilinum), polypody fern (Polypodium californicum), fiesta flower (Pholistorma auritum), and miner’s lettuce (Claytonia perfoliata) (Holland and Keil, 1995; Sawyer and Keeler-Wolf, 1995; Thorne, 1976; Brown, 1982). Munz and Keck (1949) identify similar species for this vegetation community and include a variety of grasses and soft shrubs that also are commonly found. This vegetation community can occur on all aspects, on stream sides, canyon bottoms, and flat to very steep topography. Woodlands and forests are known to occur throughout the proposed Plan Area.
Developed or Disturbed Land
Approximately 218,260 acres (17.3 percent) of developed or disturbed lands occur within the proposed Plan Area. Developed or disturbed lands consist of areas that have been disced, cleared, or otherwise altered. Developed lands may include roadways, existing buildings, and other structures. The largest areas of developed land are in the cities of Temecula, Murrieta, Lake Elsinore, Canyon Lake (including the surrounding unincorporated communities of Meadowbrook, Alberhill, El Cariso, and Lakeland Village), Hemet (including the surrounding unincorporated communities of East Hemet and Valle Vista), in Moreno Valley, and along the SR-91 corridor from Riverside through Corona and Norco. More medium-sized tracts of developed land are located in the communities of Canyon Lake (including Quail Valley, Sun City, and Homeland), in Perris along I-215 (including Mead Valley, Gavilan Hills, and Woodcrest), Beaumont, Banning (including Cherry Valley), and Calimesa. Small and scattered occurrences include the southeast portion of the proposed Plan Area along SR-371 in the unincorporated communities of Terwilliger Valley, Sage, Aguanga and Anza, east of the City of Temecula, and in Sedco Hills. Disturbed lands may include ornamental plantings for landscaping, escaped exotics, or ruderal vegetation dominated by non-native, weedy
Unknown
Approximately 1,350 acres within the proposed Plan Area were not classified into a vegetation community during the 1995 PSBS and KTU+A mapping effort.
3.1.4 Species Considered for Conservation in the Proposed MSHCP
Table 2G in Section 2.0 lists the 146 species that were considered to receive coverage under the proposed MSHCP. As shown in Table 2E, the initial list of species considered for conservation included 247 species identified for consideration by the proposed MSHCP Advisory Committee in collaboration with the Wildlife Agencies. Early in the planning process, it was determined that sufficient information was not available for many of these species to proceed with conservation planning. The initial list of 247 species was reduced to 165 species as part of the August 9, 1999 Draft MSHCP Proposal prepared by DUDEK. The list was further refined to 146 species as the proposed MSHCP planning process proceeded, and information needed to proceed with conservation planning could not be obtained for certain species. Several species were added to the list during this process as suggested by stakeholders such as the Wildlife Agencies and the California Native Plant Society (CNPS). Species added included great blue heron, Dulzura kangaroo rat, Aguanga kangaroo rat, and six plant species.
Of the 146 covered species addressed in the proposed MSHCP, 118 species are considered to be adequately conserved. The remaining 28 covered species will be considered to be adequately conserved when certain conservation requirements are met as identified in the species-specific conservation objectives for those species (speciesspecific conservation objectives for the 146 covered species are presented in Section 9.0 of the proposed MSHCP). Specific survey requirements are included in the speciesspecific conservation objectives presented in Section 9.0 of the proposed MSHCP and in Section 4.1 of this EIR/EIS. A complete summary of MSHCP species survey requirements is also provided in Appendix E of Volume I of the MSHCP.
3.2 Agricultural and Extractive Resources
3.2.1 Agriculture Resources
The proposed MSHCP Plan Area encompasses unincorporated areas of the County in addition to 14 cities located in western Riverside County. Agricultural lands are located within the jurisdiction of the County and various cities. In terms of dollar value, agriculture is the largest industry in Riverside County, providing employment for a significant number of the County's population. Agriculture faces continuing pressure from urbanization, foreign competition, and rising production costs. Despite these pressures, those areas that remain in agricultural production represent a significant open space and economic resource for the County. This section addresses important agricultural resources within the proposed MSHCP Plan Area.
State Designated Farmland
Pursuant to the provisions of Section 65570 of the California Government Code, the California Department of Conservation Farmland Mapping and Monitoring Program (FMMP) compiles important farmland maps for the state. These maps utilize data from the U.S. Department of Agriculture (USDA) Natural Resource Conservation Service (NRCS) soil survey and current land use information, representing an inventory of agricultural resources within the County. The maps depict urbanized lands and a qualitative sequence of agricultural designations. Maps and statistics are produced biannually using a process that integrates aerial photo interpretation, field mapping, a computerized mapping system, and public review.
State and federal agencies have established several classifications of important agricultural land based on factors such as soil characteristics, climate, and water supply.
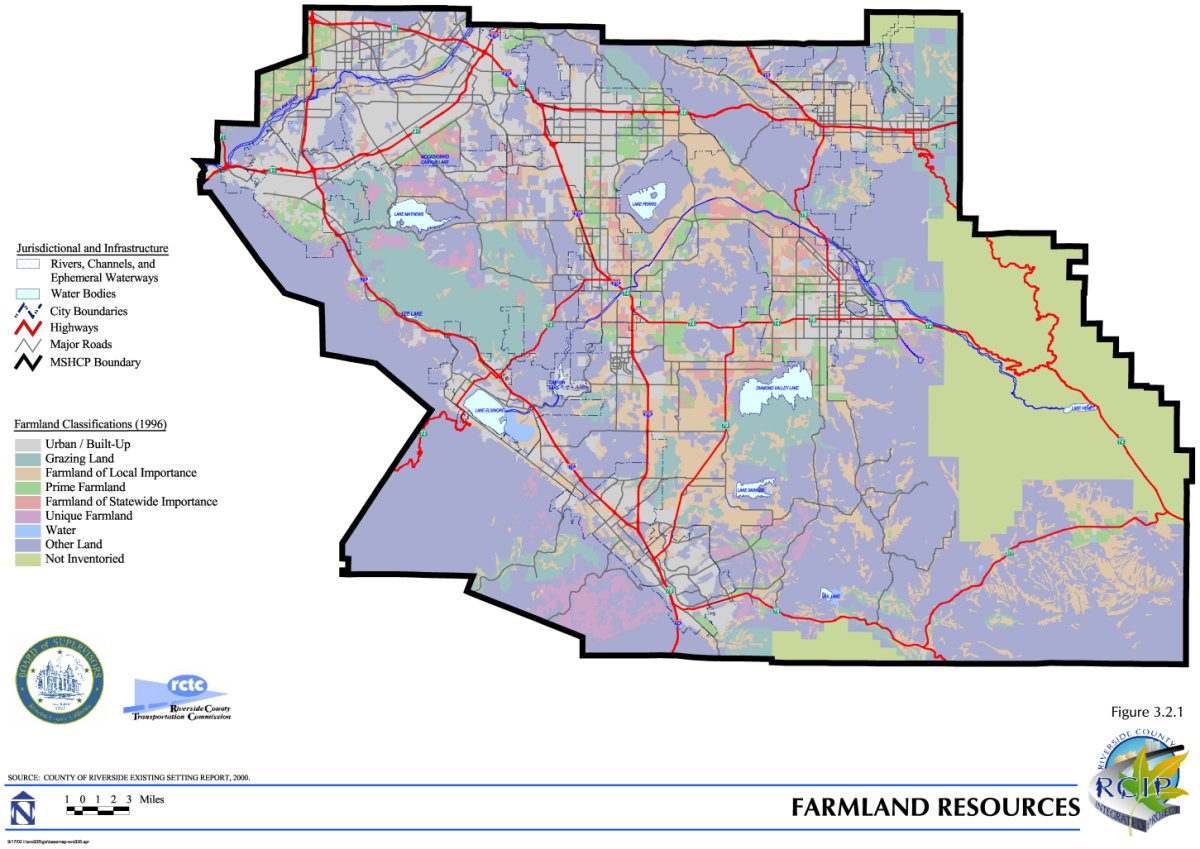
The Farmland Resource Map (Figure 3.2.1) identifies the categories of important agricultural land within the proposed MSHCP Plan Area, as defined by State and federal agencies. Categories of land mapped include the following:
- Prime Farmland;
- Farmland of Statewide Importance;
- Unique Farmland;
- Farmland of Local Importance; and
- Grazing Land.
Prime Farmland. Prime Farmland is land that has the best combination of physical and chemical characteristics for the production of crops. It has the soil quality, growing season, and moisture supply needed to produce sustained high-yield crops when treated and managed, including water management, according to current farming methods. Prime Farmland must have been used for the production of irrigated crops at some time during the two update cycles prior to the mapping date. These lands are best suited for producing food, feed, forage, fiber, and oilseed crops and have minimal management problems. Prime Farmland does not include publicly owned lands for which there is an adopted policy preventing agricultural use.
Farmland of Statewide Importance. Farmland of Statewide Importance is similar to Prime Farmland but with minor shortcomings, such as greater slopes or less ability to store soil moisture. Land must have been used for production of irrigated crops at some time during the two update cycles prior to the mapping date. Lands within this category may have associated management problems such as increased alkaline or saline soils, and have a moderate erosion hazard. Farmland of Statewide Importance does not include publicly owned lands for which there is an adopted policy preventing agricultural use.
Unique Farmland. Unique Farmland is land of lesser quality soils currently and specifically used for the production of the State's leading agricultural crops (as listed in California Agriculture, California Department of Food and Agriculture). It has the special combination of soil quality, location, growing season, and moisture supply needed to produce sustained high quality or high yields of a specific crop when treated and managed according to current farming methods. Unique Farmland is usually irrigated, but may include nonirrigated orchards or vineyards found in some climatic zones in California. Examples of crops on Unique Farmland include oranges, olives, avocados, rice, grapes, and cut flowers. Land must have been cropped at some time during the two cycles prior to the mapping date. Unique Farmland does not include publicly owned lands for which there is an adopted policy preventing agricultural use. Farmland of Local Importance. Farmland of importance to the local agricultural economy is determined by the County Board of Supervisors and a local advisory committee. These farmlands include agricultural areas with soils that would be classified as "Prime" and "Statewide Important" but lack available irrigation water, lands producing major (but not unique) crops, dairylands (including corrals, pasture, milking facilities, etc.), lands identified by City or County ordinance as agricultural zones or contracts (including Riverside City "Proposition R" lands), and lands planted in jojoba that are under cultivation and are of producing age.
Grazing Land. This includes land on which the existing vegetation is suited to the grazing of livestock.
Table 3C summarizes the acreages of the various State designated farmland categories within unincorporated areas and cities within the proposed MSHCP Plan Area. Within the MSHCP Plan Area, 99,090 acres have been designated as Prime, Unique, or Statewide Important farmland. The majority of this Designated farmland, 67,960 acres (69%) is located in unincorporated Riverside County. After Riverside County, the highest concentration of Designated farmland is located in the City of Riverside (5,778 acres/6%), followed by the Cities of San Jacinto and Moreno Valley, at 5,448 acres (5%) and 5,298 acres (5%), respectively.
| Table 3C - State Designated Farmland within Western Riverside County (Acres) |
|||||
|---|---|---|---|---|---|
| Jurisdiction | Prime | Unique | Statewide Important |
Total | % of Total |
| Riverside County | 29,735 | 26,609 | 11,616 | 67,960 | 68.6 |
| Banning | 202 | 0 | 0 | 202 | 0.2 |
| Beaumont | 132 | 0 | 0 | 132 | 0.1 |
| Calimesa | 232 | 26 | 0 | 258 | 30 |
| Canyon Lake | 0 | 0 | 0 | 0 | 0.0 |
| Corona | 2,792 | 1,023 | 223 | 4,038 | 4.1 |
| Hemet | 3,368 | 38 | 695 | 4,101 | 4.1 |
| Lake Elsinore | 52 | 19 | 0 | 71 | 0.1 |
| Moreno Valley | 4,614 | 44 | 640 | 5,298 | 5.3 |
| Murrieta | 209 | 290 | 16 | 515 | 0.5 |
| Norco | 3 | 0 | 14 | 17 | 0.0 |
| Perris | 1,938 | 216 | 2,524 | 4,678 | 4.7 |
| Riverside | 2,675 | 545 | 2,558 | 5,778 | 5.8 |
| San Jacinto | 1,610 | 863 | 3,011 | 5,448 | 5.5 |
| Temecula | 537 | 7 | 14 | 558 | 0.6 |
| TOTALS | 48,099 | 29,680 | 21,311 | 99,090 | 100.0 |
| Note: Totals may not add due to rounding errors. Source: Farmland Mapping and Monitoring Program. |
|||||
Existing Agricultural Use
While land may be designated by the State as Prime, Unique, or Statewide Important farmland, it may not be actively utilized for the production of crops or the husbandry of livestock. Agricultural lands include areas occupied by dairies and livestock feed yards or areas that have been tilled for use as croplands or groves/orchards. The largest areas of dairy and livestock feed yards are located north of San Jacinto and north of Juniper Flats in the communities of Lakeview, Mystic Lake, Nuevo, southeast Perris, Eastvale, Lake Norconian off Bellegrave Avenue, Norco, and in Glen Avon. Field croplands are mapped extensively throughout the proposed Plan Area. The largest areas are around State Route 371 (SR-371) in the vicinity of Anza; in an east-west strip from Murrieta Hot Springs; through French Valley, Antelope Valley, Paloma Valley, and Menifee Valley; Winchester; Domenigoni Valley to West Hemet; the Diamond Valley area; and in Eastvale. The largest area of grove/orchard use is in Santa Rosa East between Gavilan Mountain and Mesa de Colorado.
An interpretation of land use undertaken during the preparation of the Existing Setting Report (1999) for the 2002 Riverside County General Plan identified approximately 161,792 acres within western Riverside County utilized for some manner of agricultural production (Table 3D). The majority of this active agricultural land, 110,269 acres (68%), is located in unincorporated Riverside County. After Riverside County, the highest concentration of active agricultural land is located in the City of Perris (9,859 acres/6%), followed by Moreno Valley at 8,519 acres (5%), and San Jacinto at 8,350 acres (5%).
| Table 3D - Existing Agricultural Use in Western Riverside County | ||
|---|---|---|
| Jurisdiction | Existing Agricultural Use (acres) |
% of Total |
| Riverside County | 110,269 | 68.2 |
| Banning | 1,317 | 0.8 |
| Beaumont | 3,609 | 2.2 |
| Calimesa | 761 | 0.5 |
| Canyon Lake | 2 | 0.0 |
| Corona | 3,557 | 2.2 |
| Hemet | 4,243 | 2.6 |
| Lake Elsinore | 256 | 0.2 |
| Moreno Valley | 8,519 | 5.3 |
| Murrieta | 2,669 | 1.6 |
| Norco | 634 | 0.4 |
| Perris | 9,859 | 6.1 |
| Riverside | 6,433 | 4.0 |
| San Jacinto | 8,350 | 5.2 |
| Temecula | 1,314 | 0.8 |
| TOTAL | 161,792 | 100.0 |
| Source: Existing Setting Report, 1999. | ||
3.2.2 Mineral Resources within the Proposed MSHCP Plan Area
As Riverside County entered the 20th century, natural building materials (such as wood products) became scarce, and the industry turned to cement and clay products as durable structural replacements. Cement and clay resources in Riverside County were so rich that in the early 1900s, the value of these commodities surpassed the value of all other mineral products in the County. Today, these industrial commodities are the most significant mineral resources extracted in Riverside County.
It is anticipated that future mineral production will focus on these industrial commodities required for the urban expansion that will likely accompany projected increases in Riverside County population. The estimated value of California's mineral production for 1992 was approximately $2.5 billion, 80 percent of which was from industrial minerals (cement and clay). Riverside County's mineral production mirrors that of the State and, in 1997, the County produced over 21.27 million tons of industrial minerals, the largest group being from mines that produced construction aggregate (Table 3E).
| Table 3E - Mineral Production in Riverside County | ||
|---|---|---|
| Mineral Resource | Production (tons) | |
| Sand and Gravel | 17,444,706 | |
| Stone | 2,261,465 | |
| Clay | 284,528 | |
| Decomposed Granite | 169,092 | |
| Gypsum | 900 | |
| Iron Ore | 50 | |
| Other Mineral Commodities | 1,114,476 | |
| Source: Existing Setting Report, 1999. | ||
In accordance with classification guidelines established by the State Mining and Geology Board (SMGB) and in compliance with the Surface Mining and Recovery Act of 1975 (SMARA), the State Geologist is required to classify, based on geological factors and without regard to existing land use and ownership, the following:
- Areas containing few or no mineral deposits;
- Areas containing significant mineral deposits; or
- Areas containing mineral deposits, the significance of which requires further evaluation.
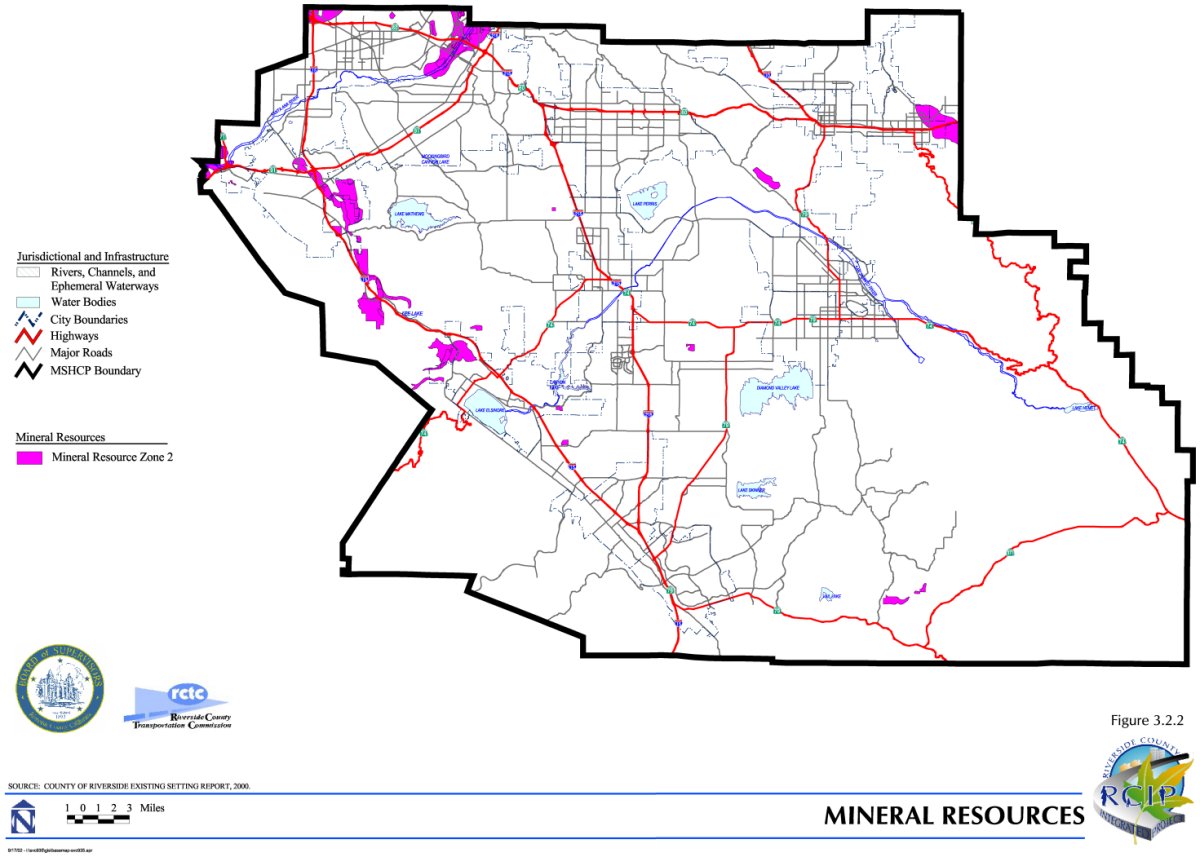
The SMGB has subsequently assigned the above categories into Mineral Resource Zones (MRZs). These zones have been established based on the presence or absence of significant sand and gravel deposits and crushed rock source areas, products used in the production of cement. The guidelines for establishing the MRZs are as follows:
MRZ-1 Areas where adequate information indicates that no significant mineral deposits are present, or where it is judged that there is little likelihood for their presence.
MRZ-2 Areas where adequate information indicates that significant mineral deposits are present or where it is judged that there is a high likelihood for their presence.
MRZ-3 Areas containing mineral deposits, the significance of which cannot be evaluated from available data.
MRZ-4 Areas where available information is inadequate for assignment to any other MRZ.
As detailed in Figure 3.2.2, areas identified as MRZ-2 are located throughout the proposed Plan Area. In western Riverside County, there are approximately 19,700 acres of land categorized as MRZ-2, 794,900 acres of land categorized as MRZ-4, and a total of 444,500 acres that have not been studied for the presence of significant mineral resources. Areas designated MRZ-2 and mining operations within the proposed MSHCP Plan Area are generally concentrated around major drainages and valleys. Within western Riverside County, the largest area of MRZ-2 land is in Temescal Canyon between the Cities of Lake Elsinore and Corona.
Table 3F summarizes the approximate acreages of MRZ-2 areas in the cities in the proposed MSHCP Plan Area.
| Table 3F - MRZ-2 Land within the Proposed MSHCP Plan Area | ||
|---|---|---|
| City | MRZ-2 Land (Acres) |
|
| Banning | 1,400 | |
| Corona | 2,300 | |
| Lake Elsinore | 1,000 | |
| Riverside | 1,700 | |
| Unincorporated Riverside County | 13,100 | |
| Total | 19,500 | |
| Source: Existing Setting Report, 1999. | ||
Existing land use information for the cities and western County indicate that approximately 22 percent of MRZ-2 land (approximately 4,300 acres) is currently in use for mineral resource extraction within the Plan Area. As discussed above, since these areas are generally concentrated around major drainages and valleys, other types of land use compete with mineral extraction use for these areas. Valleys may be in demand for residential and urban development, as they often do not have steep slopes and have suitable geological conditions for supporting structures. Drainages have high value for recreation and natural areas, and may attract nearby development by providing scenic views. The MRZ-2 designation does not indicate that mineral extraction is the only land use for the area, but rather indicates that the area may be suitable for mineral extraction use.
3.3 Population, Housing, and Employment
3.3.1 Population
The population of western Riverside County in 1999 was 1,147,629 (California Department of Finance, 1999), an increase of 64,633 persons, or 6 percent, over 1,082,996 persons reported in 1994. The 14 cities that comprise western Riverside County had a 1999 population of 829,332, or 72 percent of the region's population. The cities have grown 7.9 percent between 1994 and 1999, while the unincorporated areas in western Riverside County only grew 1.1 percent during the same time period. As shown in Table 3G, western Riverside County, as a whole, is growing at the same rate as both the region and State. Table 3H shows the population breakdown within the western unincorporated area, by Plan Area. The unincorporated area with the largest population is the Jurupa Plan Area.
| Table 3G - Regional Population Growth Trends, 1994-1999 | |||
|---|---|---|---|
| Area | 1994 | 1999 | Change |
| WRCOG1 | 1,082,996 | 1,147,629 | 6.0% |
| Cities | 768,272 | 829,332 | 7.9% |
| Unincorporated | 314,724 | 318,297 | 1.1% |
| SCAG2 Region | 15,603,036 | 16,545,220 | 6.0% |
| California | 31,960,623 | 33,773,466 | 5.7% |
| Notes: 1 Western Riverside County Organization of Governments 2 Southern California Association of Governments Source: 1998 Regional Transportation Plan, Department of Finance. As of September 13, 2002, this is the most recent demographic information that WRCOG has. |
|||
| Table 3H - Population, Households, and Employment within Unincorporated WesternRiverside County, 1997 | ||||||
|---|---|---|---|---|---|---|
| Plan Area | Population | % | Households | % | Employment | % |
| Jurupa | 81,836 | 26.2 | 24,578 | 23.3 | 16,923 | 34.1 |
| Highgrove/Northside | 7,378 | 2.4 | 2,426 | 2.3 | 1,626 | 3.3 |
| Reche Canyon/ Badlands | 1,765 | 0.6 | 596 | 0.6 | 204 | 0.4 |
| Eastvale | 2,558 | 0.8 | 751 | 0.7 | 765 | 1.5 |
| Temescal Canyon | 24,977 | 8.0 | 7,533 | 7.1 | 3,789 | 7.6 |
| Woodcrest/ Lake Mathews | 22,445 | 7.2 | 6,725 | 6.4 | 3,564 | 7.2 |
| March Air Force Base | 3,517 | 1.1 | 1,186 | 1.1 | 960 | 1.9 |
| Upper San Jacinto Valley | 35,393 | 11.3 | 13,318 | 12.6 | 3,034 | 6.1 |
| REMAP | 1,339 | 0.4 | 483 | 0.5 | 202 | 0.4 |
| Lakeview/Nuevo | 9,001 | 2.9 | 2,885 | 2.7 | 1,325 | 2.7 |
| Mead Valley | 17,243 | 5.5 | 5,090 | 4.8 | 1,002 | 2.0 |
| Greater Elsinore | 34,229 | 10.9 | 11,451 | 10.9 | 4,636 | 9.3 |
| Highway 74-79 | 12,548 | 4.0 | 4,841 | 4.6 | 1,381 | 2.8 |
| Sun City/Menifee Valley | 31,443 | 10.1 | 13,817 | 13.1 | 5,663 | 11.4 |
| Southwest Area (SWAP) | 15,253 | 4.9 | 5,177 | 4.9 | 2,679 | 5.4 |
| San Gorgonio Pass | 11,736 | 3.8 | 4,513 | 4.3 | 1,882 | 3.8 |
| Total | 312,660 | 100 | 105,373 | 100 | 49,635 | 100 |
| Source: County of Riverside Housing Element, 2001. | ||||||
The Cities of Riverside and Moreno Valley are the largest in the study area, by population. Together, the two cities contain 397,547 persons or approximately 35 percent of the study area population. The cities that experienced the most rapid population growth during the 1990s are Corona (64.2%), Perris (68.6%), and Temecula (113.0%). The City of Norco experienced the least rapid growth during the 1990s. Table 3I demonstrates the historic and projected population growth within the cities. Historical and forecast changes in population are important considerations for conservation planning, since they represent the primary causes of urban development and habitat loss.
| Table 3I - Population Growth Trends within Cities of Western Riverside County | |||||
|---|---|---|---|---|---|
| City | 1990 | 2000 | 2010 | 2025 | % Change 2000-2025 |
| Banning | 20,570 | 23,562 | 34,811 | 47,328 | 101 |
| Beaumont | 9,685 | 11,384 | 26,279 | 56,450 | 396 |
| Calimesa1 | 0 | 7,139 | 13,112 | 29,554 | 314 |
| Canyon Lake1 | 0 | 9,952 | 10,675 | 10,702 | 8 |
| Corona | 76,095 | 124,966 | 138,896 | 156,522 | 25 |
| Hemet | 36,094 | 58,812 | 80,904 | 127,899 | 117 |
| Lake Elsinore | 18,285 | 28,928 | 49,338 | 81,820 | 183 |
| Moreno Valley | 118,779 | 142,381 | 169,459 | 221,343 | 555 |
| Murrieta1 | 0 | 44,282 | 67,601 | 96,382 | 118 |
| Norco | 23,302 | 24,157 | 29,579 | 30,568 | 27 |
| Perris | 21,460 | 36,189 | 52,985 | 109,377 | 202 |
| Riverside | 226,505 | 255,166 | 302,507 | 340,328 | 33 |
| San Jacinto | 16,210 | 23,779 | 46,983 | 67,115 | 182 |
| Temecula | 27,099 | 57,716 | 76,704 | 86,000 | 49 |
| Total | 594,084 | 848,413 | 1,099,833 | 1,461,388 | 72 |
| Note: 1 Calimesa, Canyon Lake, and Murrieta were incorporated after the 1990 Census. Sources: 1990 Census, 2000 Census, SCAG. |
|||||
3.3.2 Housing
Total housing in western Riverside County in 2000 was estimated to be 389,342 of which 264,753, or about 68 percent, were single family detached units (California Department of Finance, E-5 Series 2000). Between 1990 and 2000, total housing units increased by 52,275 units, or 15.5 percent. Because the housing unit increase was less than the population increase, the average household size increased from 2.98 in 1990 to 3.17 in 2000. Table 3J shows the historic and projected housing growth within the cities of western Riverside County. The Cities of Corona, Hemet, and Temecula had the largest growth in housing during the 1990s. The cities of Beaumont, Calimesa, and Perris are expected to have the largest housing growth through 2020. Table 3H shows the housing breakdown within the western unincorporated area, by Plan Area. The unincorporated area with the largest number of households is the Jurupa Plan Area.
| Table 3J - Housing Growth Trends within Cities of Western Riverside County | |||||
|---|---|---|---|---|---|
| City | 1990 | 2000 | 2010 | 2025 | % Change 2000-2025 |
| Banning | 8,279 | 9,735 | 11,614 | 15,904 | 63 |
| Beaumont | 3,718 | 4,258 | 9,249 | 20,544 | 382 |
| Calimesa1 | 0 | 3,229 | 5,523 | 12,316 | 281 |
| Canyon Lake1 | 0 | 4,036 | 3,727 | 3,794 | |
| Corona | 26,480 | 38,903 | 42,382 | 52,303 | 34 |
| Hemet | 19,692 | 29,287 | 31,388 | 38,922 | 33 |
| Lake Elsinore | 6,993 | 9,436 | 15,220 | 25,099 | 166 |
| Moreno Valley | 37,945 | 41,388 | 48,170 | 65,679 | 59 |
| Murrieta1 | 0 | 14,800 | 21,753 | 31,091 | 110 |
| Norco | 5,785 | 6,238 | 7,138 | 7,603 | 22 |
| Perris | 7,780 | 10,484 | 15,669 | 34,395 | 228 |
| Riverside | 80,260 | 85,631 | 93,245 | 109,803 | 282 |
| San Jacinto | 6,845 | 9,340 | 15,296 | 21,650 | 132 |
| Temecula | 10,659 | 18,749 | 23,140 | 27,742 | 48 |
| Total | 214,436 | 285,514 | 343,514 | 466,845 | 64 |
| Note: 1 Calimesa, Canyon Lake, and Murrieta were incorporated after the 1990 Census. Sources: 1990 Census, 2000 Census, SCAG. |
|||||
3.3.3 Employment
In 2000, employment within the cities of western Riverside County was 301,501. The unincorporated areas of the County had a total employment of 49,635 (Table 3H) in 1997. The region's employment is expected to rise 54.6 percent by the year 2010 and approximately another 20.3 percent between 2010 and 2020. Rapid increases are projected to occur in Beaumont, Lake Elsinore, and Murrieta by 2010. Less growth is expected to occur in Norco and the unincorporated areas of western Riverside County. Table 3H shows the employment breakdown within the western unincorporated area by Plan Area. The unincorporated area with the largest employment is the Jurupa Plan Area.
3.3.4 Region and City/County Forecasts
SCAG and local jurisdictions of western Riverside County periodically prepare forecasts of population, housing, and economic growth for the region, cities, and unincorporated communities. According to these forecasts, the region's population is expected to grow 56 percent between 2000 and 2020. Total housing units are expected to grow 47.4 percent, and employment to increase 86 percent.
Forecasts of population, housing, and employment for the proposed MSHCP cities are shown in Tables 3I, 3J, and 3K. The most rapid increases in population are projected for Beaumont (72 percent between 2010 and 2020) and Calimesa (78.6%). Similarly, rapid increases in total housing units are projected for Beaumont (76.7 percent from 2010 to 2020) and Calimesa (77.2%). Employment in Beaumont is projected to increase 33.5 percent between 2010 and 2020, followed by Murrieta (32%), and Calimesa (28.4%).
| Table 3K - Employment Growth within the Cities of Western Riverside County | ||||||
|---|---|---|---|---|---|---|
| City | 2000 | 2010 | 2025 | % Change 2000-2025 |
||
| Banning | 8,453 | 12,145 | 15,342 | 81 | ||
| Beaumont | 6,185 | 14,811 | 22,291 | 260 | ||
| Calimesa | 1,867 | 3,692 | 5,273 | 182 | ||
| Canyon Lake | 1,958 | 2,451 | 2,875 | 47 | ||
| Corona | 41,583 | 56,751 | 69,905 | 68 | ||
| Hemet | 17,818 | 23,859 | 29,095 | 63 | ||
| Lake Elsinore | 8,289 | 17,539 | 25,562 | 208 | ||
| Moreno Valley | 33,163 | 53,887 | 71,859 | 117 | ||
| Murrieta | 8,447 | 19,028 | 28,205 | 234 | ||
| Norco | 8,891 | 10,631 | 12,140 | 37 | ||
| Perris | 11,701 | 22,747 | 32,300 | 176 | ||
| Riverside | 125,938 | 182,943 | 232,326 | 84 | ||
| San Jacinto | 6,328 | 11,215 | 15,455 | 144 | ||
| Temecula | 20,880 | 34,471 | 46,260 | 122 | ||
| Total | 301,501 | 466,170 | 608,888 | 102 | ||
| Source: SCAG, 2001 RTP Growth Forecast. | ||||||
The unincorporated areas of western Riverside County have slightly different growth rate trends than do the cities within the region. The growth projections in population, housing, and employment are shown in Table 3L.
| Table 3L - Growth Forecasts for the Unincorporated Western Riverside County | ||||
|---|---|---|---|---|
| 2010 | 2025 | 2040 | Annual % Change |
|
| Population | 490,941 | 771,595 | 1,234,552 | 4 |
| Housing | 160,440 | 254,582 | 407,331 | 4 |
| Employment | 135,750 | 192,918 | 279,731 | 3 |
| Source: SCAG, 2001 RTP Growth Forecast, 2040 numbers are derived from 2010 and 2025 forecasts. | ||||
Developed land in residential use within unincorporated western Riverside County totaled 141,050 acres in 1999. Between 1999 and the build out of unincorporated western Riverside County, developed residential land within western Riverside County is projected to increase by 420 percent to 592,957 acres, as shown in Table 3M.
For the purpose of this study, employment land use includes lands developed for heavy industrial, light industrial, business park, mineral extraction, public facilities, retail, office, schools, tourist/commercial, utilities, and warehouse facilities. Developed land in these uses in 1999 totaled 59,897 acres in western Riverside County. This is projected to increase 258 percent to 154,559 acres by build out of unincorporated western Riverside County, as shown in Table 3M.
| Table 3M - Developed Residential and Employment Land Use | ||||||
|---|---|---|---|---|---|---|
| City | Residential Land Use | Employment Land Use1 | ||||
| Developed Land (Acres) |
Developed Land (Acres) |
Vacant Developable Land (Acres) |
||||
| 1999 | Build Out | 1999 | Build Out | 1999 | ||
| Banning | 2,503 | 2,4302 | 1,623 | 1,323 | 9,161 | |
| Beaumont | 1,017 | 16,155 | 972 | 2,600 | 10,934 | |
| Calimesa | 1,347 | 6,132 | 426 | 759 | 6,885 | |
| Canyon Lake | 1,264 | 1,576 | 51 | 151 | 1,057 | |
| Corona | 8,150 | 13,157 | 4,711 | 4,0123 | 6,245 | |
| Hemet | 5,068 | 35,852 | 1,776 | 6,945 | 3,936 | |
| Lake Elsinore | 2,771 | 15,211 | 1,625 | 4,446 | 16,765 | |
| Moreno Valley | 10,763 | 35,954 | 2,789 | 11,603 | 10,141 | |
| Murrieta | 5,099 | 25,813 | 1,771 | 9,662 | 8,359 | |
| Norco | 3,585 | 5,465 | 1,309 | 1,686 | 2,933 | |
| Perris | 2,574 | 17,703 | 1,784 | 8,458 | 5,941 | |
| Riverside | 20,624 | 42,337 | 10,059 | 13,988 | 12,146 | |
| San Jacinto | 2,302 | 3,832 | 1,487 | 1,557 | 3,237 | |
| Temecula | 5,992 | 14,067 | 2,836 | 3,772 | 5,947 | |
| County | 67,991 | 357,273 | 26,678 | 83,597 | 735,055 | |
| Total | 141,050 | 592,957 | 59,897 | 154,559 | 811,762 | |
| Notes: 1 Included in Employment Land Use is: Heavy Industrial, Light Industrial/Business Park, Mineral Extraction, Public Facilities, Retail/Office, Schools, Tourist/Commercial, Utilities, and Warehouse land use designations. 2 The City of Banning's latest General Plan update was done in 1986, thus numbers in this table are projected for year 2000. 3 This is from the Corona 1986 General Plan. As of this writing, the City of Corona is currently updating the General Plan. Source: LSA GIS data and City General Plans. |
||||||
3.4 Public Services (Fire Protection and Parks)
3.4.1 Fire
Fire protection is provided throughout the County by the Riverside County Fire Department/California Department of Forestry, individual city fire departments, and several district fire departments. Western Riverside County Service Area The Riverside County Fire Department, which is part of the California Department of Forestry, provides the primary fire protection services to the unincorporated areas of western Riverside County. The County of Riverside operates 85 fire stations in the County, 58 of which are within western Riverside County. Twenty-one of the stations are located in the unincorporated area of the western County. Nine cities in western Riverside County contract with the County of Riverside for fire protection services. These cities include:
- Banning
- Beaumont
- Calimesa
- Canyon Lake
- Temecula
- Lake Elsinore
- Moreno Valley
- Perris
- San Jacinto
The County is part of a mutual aid program with all of the cities in the County. Upon the receipt of a call for mutual aid through the County's Emergency Command Center, the County's mutual aid coordinator will determine whether the city or County will provide a response. The Department also provides the following services:
- Weed abatement
- Ambulance response
- Swift water rescue
- Level 1 hazardous material team
County Fire Stations County fire stations serving western Riverside County are identified in Table 3N.
| Table 3N - Fire Stations Serving Western Riverside County | ||
|---|---|---|
| Station Number | County Fire Stations | |
| Name | Location | |
| 1 | Perris | 210 West San Jacinto Avenue, Perris |
| 2 | Sunnymead | 23770 Sunnymead Boulevard, Moreno Valley |
| 3 | Nuevo | 29490 Lakeview Avenue, Nuevo |
| 4 | Cajalco | 17650 Cajalco Boulevard, Perris |
| 5 | Quail Valley | 28971 Goetz Road, Quail Valley |
| 6 | Edgemont | 22250 Eucalyptus Avenue, Moreno Valley |
| 7 | Sun City | 27860 Bradley Road, Sun City |
| 8 | Woodcrest | 17800 Van Buren Boulevard, Riverside |
| 9 | Goodmeadow | 21565 Steele Peak Road, Perris |
| 10 | Elsinore | 410 West Graham Avenue, Lake Elsinore |
| 11 | Lakeland Village | 17643 Brightman Avenue, Lake Elsinore |
| 12 | Temecula | 28330 Mercedes Street, Temecula |
| 13 | Home Gardens | 135 North McKinley Street, Corona |
| 14 | Corona | 1511 Hamner Avenue, Norco |
| 15 | El Cerrito | 20320 Temescal Canyon Road |
| 16 | Pedley | 9270 Limonite Avenue, Pedley |
| 17 | Glen Avon | 10400 San Sevaine Way, Mira Loma |
| 18 | West Riverside | 7545 Mission Boulevard, Riverside |
| 19 | Highgrove | 469 Center Street, Highgrove |
| 20 | Beaumont | 1550 East 6th Street, Beaumont |
| 21 | Calimesa | 906 Park Avenue, Calimesa |
| 22 | Cherry Valley | 10055 Avenida Mira Villa, Cherry Valley |
| 23 | Pine Cove | 24919 Marion Ridge Road, Idyllwild |
| 25 | San Jacinto | 132 South San Jacinto, San Jacinto |
| 26 | Little Lake | 25954 Stanford Street, Hemet |
| 27 | Ryan Field | 36850 Stetson Avenue, Hemet |
| 28 | Sage | 37381 Sage Road, Sage |
| 29 | Anza | 56560 Hwy 371, Anza |
| 30 | Pinyon | 70080 Highway 74, Mountain Center |
| 38 | Rubidoux | 3590 Rubidoux Boulevard, Riverside |
| 48 | Sunnymead Ranch | 10511 Village Road, Moreno Valley |
| 51 | El Cariso | 32353 Ortega Highway, Lake Elsinore |
| 52 | Cottonwood | 44222 Sage Road, Aguanga |
| 53 | Garner Valley | 59200 Morris Ranch Road, Mountain Center |
| 54 | Homeland | 25730 Sultanas Road, Homeland |
| 58 | Moreno | 28020 Bay Avenue, Moreno Valley |
| 59 | Mead Valley | 19450 Clark Street, Perris |
| 60 | Canyon Lake | 28730 Vacation Drive, Canyon Lake |
| 61 | Wildomar | 32637 Gruwell Street, Wildomar |
| 62 | Rancho Carrillo | Lot #51 Verdugo Road, San Juan Capistrano |
| 63 | Poppet Flats | 49575 Orchard, Banning |
| 64 | Juniper Flats | Vacant |
| 65 | Dennedy Park | 15111 Indian Avenue, Moreno Valley |
| 66 | Beaumont City | 628 Maple Street, Beaumont |
| 68 | Menifee | 26020 Wickerd Road, Menifee |
| 72 | Valley Vista | 25175 Fairview, Hemet |
| 73 | Rancho California | 27415 Enterprise Circle West, Temecula |
| 74 | Rancho Capistrano | 35420 Calle Grande, Lake Elsinore |
| 75 | Bear Creek | 38900 Clinton Keith Road, Murrieta |
| 76 | Menifee Lakes | Menifee (to be constructed) |
| 77 | Lake Riverside | Aguanga |
| 83 | French Valley | 37500 Sky Canyon Drive, Murrieta |
| 84 | Parkview | 30650 Pauba Road, Temecula |
| 277 | Pechanga Indian Fire | Pechanga Indian Reservation, Temecula |
| 278 | Morongo Indian Fire | 11581 Potrero Road, Banning |
| Bautista | Conservation Camp | 33015 Bautista Road, Hemet |
| Norco | Conservation Camp | 5th and Western Boulevard, Norco |
| Oak Glen | Conservation Camp | 41100 Pine Bench Road, Yucaipa |
City Fire Stations
The five western Riverside County cities that do not contract with the County of Riverside for fire protection services are Corona, Hemet, Murrieta, Norco, and Riverside.
City of Corona. Fire prevention and protection services within the City of Corona are provided by the Corona Fire Department. The Department currently operates six fire stations, and a seventh facility is in the development phase. The new facility will be located at 3777 Bedford Canyon Road. Construction on the new station is expected to begin in November 2002. The City of Corona's fire facilities are meeting the service demands with the help of the County of Riverside Fire Department. The County Fire Department is helping in the area surrounding the planned facility. After construction of the planned facility, the County Fire Department will not need to aid the City of Corona. The City of Corona has mutual aid agreements with surrounding cities, the County of Riverside, and surrounding Counties. Below is a list of current fire facilities operated by the City of Corona.
- Station 1 - 540 Magnolia Avenue
- Station 2 - 225 East Harrison Street
- Station 3 - 790 South Smith Street
- Station 4 - 915 North McKinley Street
- Station 5 - 1200 Canyon Crest
- Station 6 - 110 West Upper Drive
City of Hemet. Fire prevention and protection services within the City of Hemet are provided by the Hemet Fire Department. The Department operates four fire stations. All firefighters in the Hemet Fire Department are paid professionals; volunteer firefighters are not utilized. The City has a mutual aid agreement with the County of Riverside. The following is a list of current fire facilities operated by the City of Hemet.
- Station 1 - 220 North Juanita Street
- Station 2 - 895 West Stetson Street
- Station 3 - 4110 West Devonshire
- Station 4 - Hemet Ryan Airport
City of Murrieta. Fire prevention and protection within the City of Murrieta are provided by the Murrieta Fire Department. The Department operates three fire stations. The City is currently not planning any additional fire facilities and the current stations are meeting the service level demands. The City has a mutual aid agreement with the County of Riverside. The following is a list of current fire facilities operated by the City of Murrieta.
- Station 1 - 41825 Juniper Street
- Station 2 - 40060 California Oaks Road
- Station 3 - 39985 Whitewood Road
City of Norco. Fire prevention and protection within the City of Norco are provided by the Norco Fire Department. The Department operates two fire stations. The City is planning construction of a new fire facility. This facility will replace another older station. Thus, the City will continue to operate two fire stations. The City's fire facilities do not meet the current fire service demand. The City addresses this problem by a fee paid, mutual aid agreement with the City of Corona and the County of Riverside. Below is a list of current fire facilities operated by the City of Norco.
- Station 21 - 3367 Corydon Avenue
- Station 22 - 1281 Fifth Street
City of Riverside. Fire prevention and protection services within the City of Riverside are provided by the City of Riverside Fire Department. As of 1991, the City operates 13 fire stations within the City, and employs approximately 218 fire employees. The department has a wide range of fire fighting equipment. The City of Riverside has no planned fire facilities for the future. At this time, the City of Riverside is in need of five additional fire stations. The City of Riverside has mutual aid agreements with surrounding cities, the County of Riverside, and the County of San Bernardino. The following is a list of the fire stations that are operated by the City of Riverside.
- Station 1 - 3420 Mission Inn Avenue
- Station 2 - 9449 Andrews Street
- Station 3 - 6395 Riverside Avenue
- Station 4 - 3510 Cranford Avenue
- Station 5 - 6963 Streeter Avenue
- Station 6 - 2293 Main Street
- Station 7 - 10191 Cypress Avenue
- Station 8 - 11076 Hole Avenue
- Station 9 - 6674 Alessandro Boulevard
- Station 10 - 2590 Jefferson Street
- Station 11 - 19595 Orange Terrace Parkway
- Station 12 - 10692 Indiana Avenue
- Station 13 - 22250 Eucalyptus Avenue
3.4.2 Planned Park Facilities within the Proposed MSHCP Plan Area
The proposed MSHCP includes portions of habitat within unincorporated areas of the County in addition to habitat in the 14 cities located in western Riverside County. The habitat conservation Criteria Areas specified in the proposed MSHCP may affect, conflict, or restrict the implementation of future public park facilities in these areas; therefore, this section will address planned park facilities within the proposed MSHCP boundary and identify possible project-related impacts. Riverside County and each city in the proposed Plan Area were consulted to determine the locations of planned future park facilities. Table 3O provides a list of planned park facilities in the foreseeable future according to each jurisdiction. Because some of the parks were in different stages of planning, the information available for each park varies in detail. The most detailed available information is included in Table 3O.
| Table 3O - Future Park Facilities | ||
|---|---|---|
| Location | Park | Location |
| Aguanga | Cotton Wood Park | 44260 Sage Road |
| Banning | Smith Creek Park | East Terminus of Porter Street |
| Mountain Gate Park | Mountain Avenue and Red Bluff Lane | |
| Lincoln Street Park | Lincoln Street and Adams Street | |
| Corona | Jameson Park | Foothill Park and Parkway |
| Fresno Canyon Park | Cattle Run Road | |
| Chase Park | Chase Drive and California Avenue | |
| Rimpau Park | Rimpau Avenue and Ontario Avenue | |
| Prado Sports Complex | Lincoln Avenue and Rincon Street | |
| Stagecoach Park | Stagecoach Drive and Corydon Street | |
| Eastvale | Providence Park | Sumner and Walnut |
| McCune Family Park | Harrison and Chandler | |
| Harada Park | Schleisman and Cleveland | |
| French Valley | Butterfield Park | Benton Road and Cady Road |
| Hemet | Sante Fe Ball Field | 252 South Sante Fe Street |
| Bill Grey Park | 25330 Lake Street | |
| Valle Vista Park | 25175 Fairview Avenue | |
| Devonshire Detention Basin | Cawston and Devonshire | |
| Gibbel Park Addition | Kirby and Devonshire | |
| Park Complex | Chambers and State Street | |
| Recreation Park | Domenigoni and State Street | |
| Jurupa | JARPD Future Park | Bellgrave and Wineville |
| Lake Elsinore | Alberhill Park | Coal Road |
| North Hill Park | Data Unavailable | |
| Canyon Hills Neighborhood Park | Holland Road | |
| Canyon Hills Community Park | Holland Road | |
| Creekside Park | Lost Road | |
| Menifee | La Palma Park | 3000 Menifee Road |
| Menifee Wheatfield Park | 30827 Menifee Road | |
| Moreno Valley | Presidio Park | North of Sunnymead Ranch |
| Hidden Springs Park | Hidden Springs Drive and Sycamore Canyon | |
| Canyon Springs Golf Club | Heacock Street and Sandy Glada Avenue | |
| Murrieta | Copper Canyon Park | Red Willow and Old Oak Terrace |
| Los Alamos Hills Sports Plex | Los Alamos Road and Ruth Ellen Way | |
| Norco | Norco Park Ridge Ranch | Vaugn Street and Hillside Avenue |
| Norco Hills Park | Rock Springs Avenue | |
| 122-Acre Parcel Park | Hamner Avenue | |
| Perris | City of Perris Park | I-215 and 7th Street |
| Riverside | Andulka Park | 5079 Chicago Avenue |
| Golden Park | Golden Avenue and Campbell Avenue | |
| Tequesquite Park | 4825 Tequesquite Avenue | |
| Temecula | Crown Hill Park | Pauba Road and Via Del Monte |
| Crown Hill Park 2 | Old Kent Road | |
| Meadows Park | Highway 79 and Meadows Parkway | |
| Paseo Del Sol | Meadows Parkway | |
| Linear Park | Wolf Valley Road | |
| Neighborhood Park | Pala Road | |
| Community Park | Equity Drive | |
| Lake Park | Margarita Road | |
| Arroyo Park | Date Street and Ynez Road | |
| City Sports Park | Pala Road and Deer Hollow | |
| Winchester | Winchester Park | 100 Haddock Street |
3.5 Transportation and Circulation
The existing circulation and transportation system serving the proposed MSHCP Plan Area, western Riverside County, is composed of a series of separate modes or types of passenger travel and goods movement. These modes of travel and goods movement include passenger vehicles and truck freight, transit, passenger and freight rail, passenger and cargo air, non-motorized systems (bicycle facilities, pedestrian facilities, and equestrian facilities) and major utility corridors.
3.5.1 Existing Transportation/Circulation Conditions
The proposed Plan Area's transportation system is composed of numerous State highways (both freeways and arterial highways), as well as numerous County and city routes. The public transit system includes fixed route public transit systems, common bus carriers, AMTRAK (intercity rail service), MetroLink (commuter rail service), and other local agency transit and paratransit services. In addition, the transportation system in the proposed Plan Area includes general aviation facilities, limited passenger air service within the proposed Plan Area, extensive air passenger facilities in the Southern California and San Diego regions, freight rail service, bicycle facilities, and other nonmotorized forms of transportation (pedestrian and equestrian trails).
Travel within the proposed Plan Area is a function of the size and spatial distribution of population and economic activity and the relationship to other major activity centers within the Los Angeles Basin or the Southern California Region (such as those located in Los Angeles, Orange, Ventura, San Bernardino, and Imperial Counties). Outside the Los Angeles Basin, other major urban centers that interact with western Riverside County include those in San Diego County to the south and Kern County located in the San Joaquin Valley to the north. In addition, there is some travel between the western and eastern portions of the County (i.e., between Riverside and Blythe). The distance between these two subregions of Riverside County is greater than the distance between the City of Riverside and the City of Oxnard in the northernmost portion of the Southern California Region (approximately 3 hours by car).
Due to the interrelationship of urban and rural activities (employment, housing and services), and the low average density of existing land uses, the private automobile is the dominant mode of travel within the proposed Plan Area. Trips by transit currently represent less than 2 percent of all trips made in the County. Public transportation, where service is available, is utilized primarily by a transit-dependent population (senior citizens, students, low-income residents, and the physically disabled) that generally does not have access to automobiles.
The proposed Plan Area's industrial and agricultural economies depend on safe and efficient goods movement. The County is responsible for maintaining an extensive network of low volume rural roads in sparsely settled areas to service goods movement and the agricultural industry. Large trucks are the primary means of transporting such goods. In addition, freight rail is an important backbone of the goods movement industry in the proposed Plan Area.
Non-motorized forms of transportation are also prevalent in the proposed Plan Area and include numerous bikeways, pedestrian facilities, and equestrian amenities.
3.5.2 Existing Street and Highway System
Figure 3.5.1 illustrates the relationship of the proposed Plan Areas's roadway system to the State highway system, nearby counties, eastern Riverside County, and major cities. The street and highway system provides a rather dense definition of roads of Countywide significance. The proposed Plan Areas's highway network, which is more dense than the eastern portion of the County, is composed of three interstate routes (I-10, I-15, and I-215), and numerous State Routes (SRs 60, 71, 74, 79, 91, 243, and 371).
In addition, the highway system includes numerous County roadways, as well as roadways within each of the 14 cities in the proposed Plan Area. Some of the major roadways include Alessandro Boulevard, Arlington Avenue, La Sierra, Limonite, and Magnolia Avenues, Market Street, Mission Boulevard, Perris Boulevard, Ramona Expressway, Rancho California Road, San Jacinto Road, Van Buren Boulevard, and Washington Street.
The proposed Plan Area is linked to Los Angeles and Orange Counties principally by SR-60 (Pomona Freeway), I-10 (San Bernardino Freeway), SR-91 (Riverside Freeway), and SR-74 (Ortega Highway). The I-15 freeway and minor conventional highways provide links to San Diego County. Links to San Bernardino County are provided by I-15 and I-215, as well as by other major and minor local roadways. The I-10 freeway also provides connection to destinations in Arizona, and I-15 and I-215 provide access through San Bernardino County to Nevada including its primary recreation areas (the City of Las Vegas and Lake Mead). In addition, I-15 provides access south to San Diego and its many tourist and recreational amenities, and to Mexico via I-5, I-15, and I-805.
Functional Classification System
Functional classification is the process by which streets and highways are grouped into classes, or systems, according to the type of service they are intended to provide. Fundamental to this process is the recognition that individual streets and highways do not serve travel independently in any major way; rather, most travel involves movement through a network of roads.
The following sections define roadway classification systems currently used by the Federal Highway Administration (FHWA), the County, and local agencies. Since issues related to the classification of roadways range from funding to operational considerations, each agency has its own classification system. These sections define and clarify the role of each system, and present the classification system used in this Section. For the most part, County road standards are generally consistent with those adopted by the local agencies in the County.
Travel should be controlled along the street and highway system in a logical and efficient manner. Functional classifications define the channelization process by defining the area that a particular street or highway should service through a circulation network.
Table 3P defines the general functional classes in urban areas of Riverside County, and Table 3Q defines general functional classes in rural areas of the County.
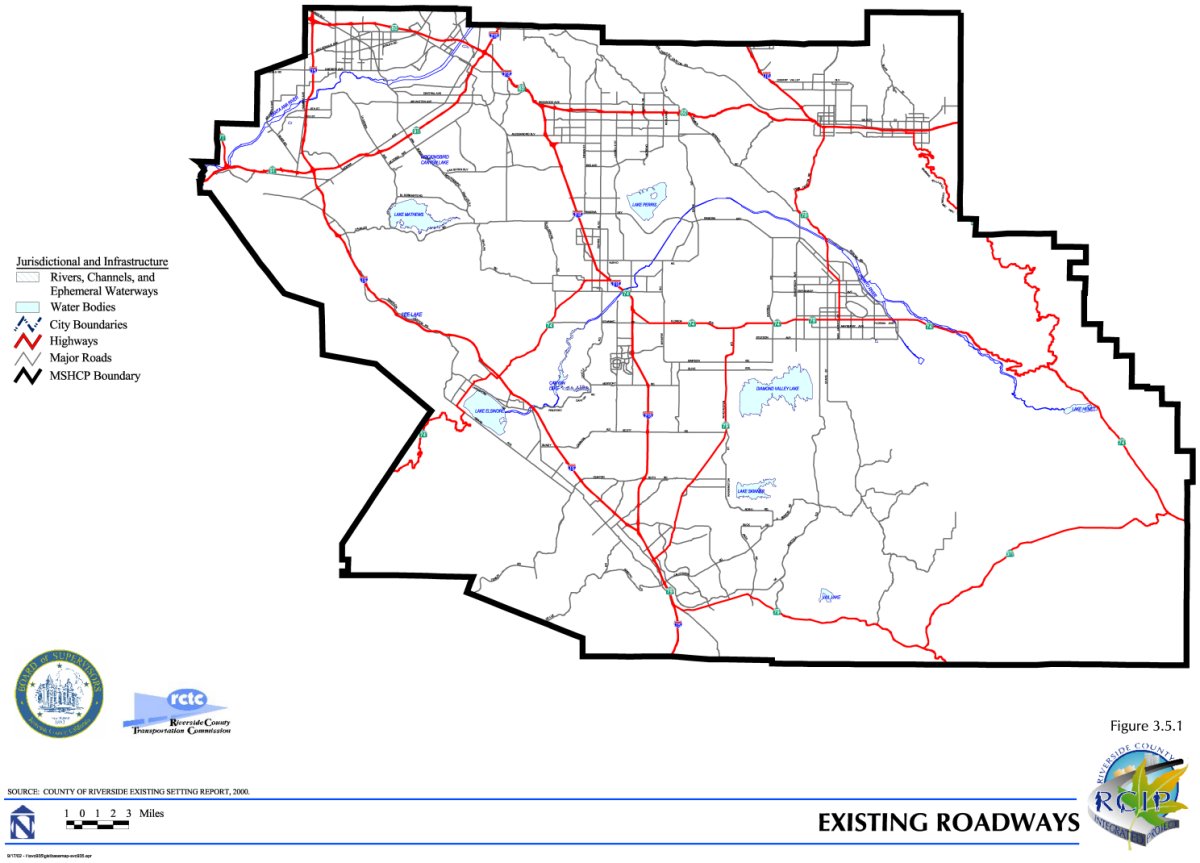
Federal Functional Classifications
Federal functional classifications, designated for both the rural and urban areas, are as follows:
| Rural | Urban |
| Interstate and Other | Interstate and Other |
| Principal Arterial | Freeways and Expressways |
| Minor Arterials | Other Principal Arterials |
| Major Collectors | Minor Arterials |
| Minor Collectors | Collectors |
| Table 3P - Generalized Urban Functional Classification System - Definitions | ||||
|---|---|---|---|---|
| Classification | Primary Function | Direct Land Access | Speed Limit | Parking |
| Freeway /Expressway | Traffic Movement | None allowed. | 45-65 | Prohibited |
| Major Arterial | Traffic Movement/Land Access | Limited access to adjoining parcels. | 35-45 | Generally Prohibited |
| Other Arterial Traffic Movement/Land Access | Restricted access to adjoining parcels. | 30-35 | Limited | |
| Collector | Distribute Traffic Between Local Streets and Arterials | Safety controls (such as stop signs), limited regulation or control on access. | 25-30 | Limited |
| Local | Land Access | Safety controls only, unlimited access in accordance with design requirements. | 25 | Permitted |
| Table 3Q - Generalized Rural Functional Classification System - Definitions | ||||
|---|---|---|---|---|
| Classification | Primary Function | Direct Land Access1 | Speed Limit2 | Parking3 |
| Freeway / Expressway | Traffic Movement | Safety controls only, unlimited access in accordance with design requirements. | 55-70 | Prohibited |
| Major and Other Arterial | Traffic Movement/Land Access | Safety controls only, unlimited access in accordance with design requirements. | 55 | Permitted |
| Collector | Distribute Traffic Between Local Streets and Arterials | Safety controls only, unlimited access in accordance with design requirements. | 55 | Permitted |
| Local | Land Access | Safety controls only, unlimited access in accordance with design requirements. | 55 | Permitted |
| Notes: 1 Access to arterials is generally limited or restricted if it provides access to a land subdivision or an industrial, commercial, or multi-family use. Access is granted on a controlled basis to parcels fronting on expressways where there is not a frontage road or access to another road. 2 All County roads have a 55-mph operating speed unless otherwise indicated. 3 Parking is permitted on all County roads unless otherwise indicated. |
||||
Existing Roadway and Highway Capacity Analysis (Street and Highway Level of Service)
The first step toward analyzing a functional street and highway system is to thoroughly assess existing traffic conditions. To accomplish this task, level of service (LOS) analyses were conducted for existing roadway segments. LOS standards are used by Riverside County, Caltrans, and local agencies to quantitatively assess the street and highway system's performance. To determine the type and number of transportation projects that may be necessary to accommodate Riverside County's expected growth; the existing LOS was assessed along selected freeway, expressway, arterial, and collector facilities.
According to the 1997 Highway Capacity Manual (HCM), LOS is categorized by two parameters of traffic: uninterrupted and interrupted flow. Uninterrupted flow facilities do not have fixed elements such as traffic signals that cause interruptions in traffic flow. Examples of such facilities would be freeways, including SR-91 and I-10. Interrupted flow facilities have fixed elements that cause an interruption in the flow of traffic, such as stop signs and signalized intersections along arterial roads. Examples of such facilities include Alessandro Boulevard, Etiwanda Avenue, Ramona Expressway, Van Buren Boulevard, and many other arterial streets within Riverside County. The difference between uninterrupted flow and interrupted LOS is defined in Table 3R and in Tables 3S and 3T.
| Table 3R - Level of Service Criteria | |||||||||
|---|---|---|---|---|---|---|---|---|---|
| LOS | Density (PC/MI/LN)1 |
Uninterrupted Flow | Interrupted Flow | ||||||
| 70 mph Freeway Speed Design |
Urban and Suburban Arterial 2 and 4 Lanes Signalized |
||||||||
| Speed (mph) |
V/C2 | MSF3 (PC/H/L)4 |
Speed (mph) |
V/C2 | Delay (sec) |
Arterial ADT5 | |||
| 2-Lane | 4-Lane | ||||||||
| A | ≤10 | ≥70 | .318/ .3045 | 700 | ≥35 | 0 - .60 | ≤5.0 | 5,000 | 18,000 |
| B | ≤16 | ≥70 | .529/ .487 | 1,100 | ≥28 | .51 - .70 | 5.1 - 15 | 8,000 | 21,000 |
| C | ≤24 | ≥68.5 | .747/ .715 | 1,550 | ≥22 | .71 - .80 | 15.1 - 25 | 10,000 | 24,000 |
| D | ≤32 | ≥63 | .916/ .876 | 1,850 | ≥17 | .81 - .90 | 25.1 - 40 | 12,000 | 27,000 |
| E | ≤36.7/ 39.7 | ≥60.0/ 58.0 | 1.000 | 2,000 | ≥13 | .91 - 1.00 | 40.1 - 60 | 13,000 | 30,000 |
| F | Varies | Varies | Varies | <13 | >1.00 | >60 | |||
| Notes: 1 PC/MI/LN: passenger cars per mile per lane. 2 V/C: Ratio of traffic volume to capacity. 3 MSF: maximum service flow rate per lane under ideal conditions (ci [capacity under ideal conditions] v/c = MSF) 4 PC/H/L: passenger cars per hour per lane. 5 ADT: average daily traffic. These figures are affected by an intersection’s degree of access control, the type of roadway, grades, design, geometrics, percent truck traffic, etc. Source: 1997 Highway Capacity Manual. |
|||||||||
| Table 3S - Uninterrupted Traffic Flow Facilities Level of Service | |
|---|---|
| Level of Service | Definition |
| A | Represents free flow. Individual vehicles are virtually unaffected by the presence of others in the traffic stream. |
| B | Is in the range of stable flow, but the presence of other vehicles in the traffic stream begins to be noticeable. Freedom to select desired speeds is relatively unaffected, but there is a slight decline in the freedom to maneuver. |
| C | Is in the range of stable flow, but marks the beginning of the range of flow in which the operation of individual vehicles becomes significantly affected by interactions with other vehicles in the traffic stream. |
| D | Is a crowded segment of roadway with a large number of vehicles restricting mobility and a stable flow. Speed and freedom to maneuver are severely restricted, and the driver experiences a generally poor level of comfort and convenience. |
| E | Represents operating conditions at or near the level capacity. All speeds are reduced to a low, but relatively uniform value. Small increases in flow will cause breakdowns in traffic movement. |
| F | Is used to define forced or breakdown flow (stop-and-go gridlock). This condition exists when the amount of traffic exceeds the amount that can travel to a destination. Operations within the queues are characterized by stop and go waves, and they are extremely unstable. |
| Source: 1997 Highway Capacity Manual. | |
| Table 3T - Interrupted Traffic Flow Facilities Level of Service | |
|---|---|
| Level of Service | Definition |
| A | Describes operations with average intersection stopped delay of five seconds or less (how long a driver must wait at a signal before the vehicle can begin moving again). |
| B | Describes operations with average intersection stopped delay in the range of 5.1 to 15.0 seconds per vehicle, and with reasonably unimpeded operations between intersections. |
| C | Describes operations with higher average stopped delays at intersections (in the range of 15.1 to 25.0 seconds per vehicle). The stable operations between locations may be restricted given the ability to maneuver and change lanes at mid-block locations. These conditions can be more restrictive than LOS B. Further, the longer queues and/or adverse signal coordination may contribute to lower average speeds. |
| D | Describes operations where the influence of delay is more noticeable (25.1 to 40.0 seconds per vehicle). Intersection stopped delay is longer and the range of travel speed is about 40 percent below the free flow speed. This is caused by inappropriate signal timing, high volumes, and some combinations of both. |
| E | Is characterized by significant approach stopped delay (40.1 to 60.0 seconds per vehicle), and average travel speeds of one-third the free flow speed or lower. These conditions are generally considered to represent the capacity of the intersection or arterial. |
| F | Characterizes arterial flow at extremely low speeds, with high intersection stopped delay (greater than 60 seconds per vehicle). Poor progression, long cycle lengths, and high traffic demand volumes may be a major contributing factor to this condition. Traffic may be characterized by frequent stop-and-go conditions. |
| Source: 1997 Highway Capacity Manual. | |
An important goal when planning the transportation system is to maintain acceptable levels of service along the interstate and State highways and the streets and roads network. To accomplish this, Caltrans, the County, and local agencies adopt minimum levels of service in an attempt to control congestion that may result as new development occurs.
The minimum LOS for purposes of the Riverside County Congestion Management Program (CMP) System is LOS E unless it was already at LOS F in 1991.
Existing Traffic Counts and Roadway Geometrics
Traffic volumes used to develop LOS calculations were obtained from Caltrans, the County of Riverside, the Coachella Valley Association of Governments (CVAG), and various cities within the County. Traffic volumes were available from these agencies for years 1993 through 1999.
To reflect 1999 traffic along the existing street and highway system in the County, traffic counts (other than 1999 counts) were adjusted based on an assumed 2 percent annual increase. The percentage increase applied is consistent with historical annual growth rates in vehicle trips in Riverside County.
Segment Level of Service Analysis
Results of the LOS segment analysis along street and highway segments are reflected in Figures 3.5-2a through 3.5-2g. Street and highway segments are defined as stretches of roadway (generally 2 miles in length) and often located between signalized or controlled intersections. The HCM-based LOS analysis is based upon a calculation of the ADT and other variables previously described, such as the number of lanes and signalized intersections along a segment considering roadway design standards adopted by Riverside County.
Results of the segment analysis (Figures 3.5-2a through 3.5-2g) indicate that street and highway segments within Riverside County are currently operating at LOS A through F. Tables 3U and 3V provide a listing of those facilities that currently do not meet the County minimum LOS standard of C or better. Tables 3U and 3V indicate that 27 of the segments are operating at LOS D, 17 are operating at LOS E, and 59 facility segments are currently operating at LOS F. As a result, these street and highway segments fall short of the minimum LOS standards of Riverside County, Caltrans, and affected local agencies.
Most of the deficient local, interstate, and State Route facilities (Tables 3U and 3V) are located in the western portion of Riverside County. In addition, it appears, based upon the analysis, that most deficiencies occur on the freeway system and other major arterials. There are some local facilities that are also deficient; however, they are not restricted just to western Riverside County. Most deficient local facilities occur along arterials in the Cities of Riverside, Coachella Valley, Moreno Valley, Temecula, and Lake Elsinore.
A number of deficient facilities operating at LOS D, E, or F have been identified (Tables 3U and 3V). The identification of these deficient facilities provides an opportunity for Riverside County, Caltrans, and other affected local agencies to focus on street and highway and other improvement projects that will improve the overall LOS in the County over time.
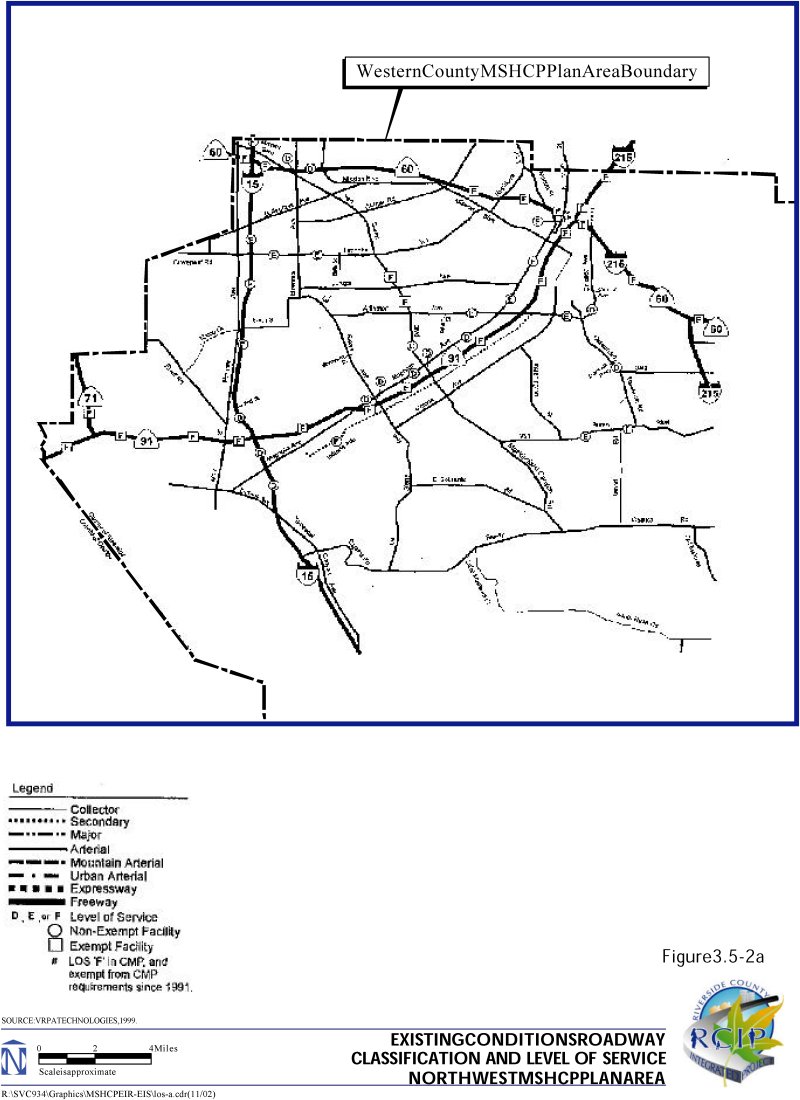
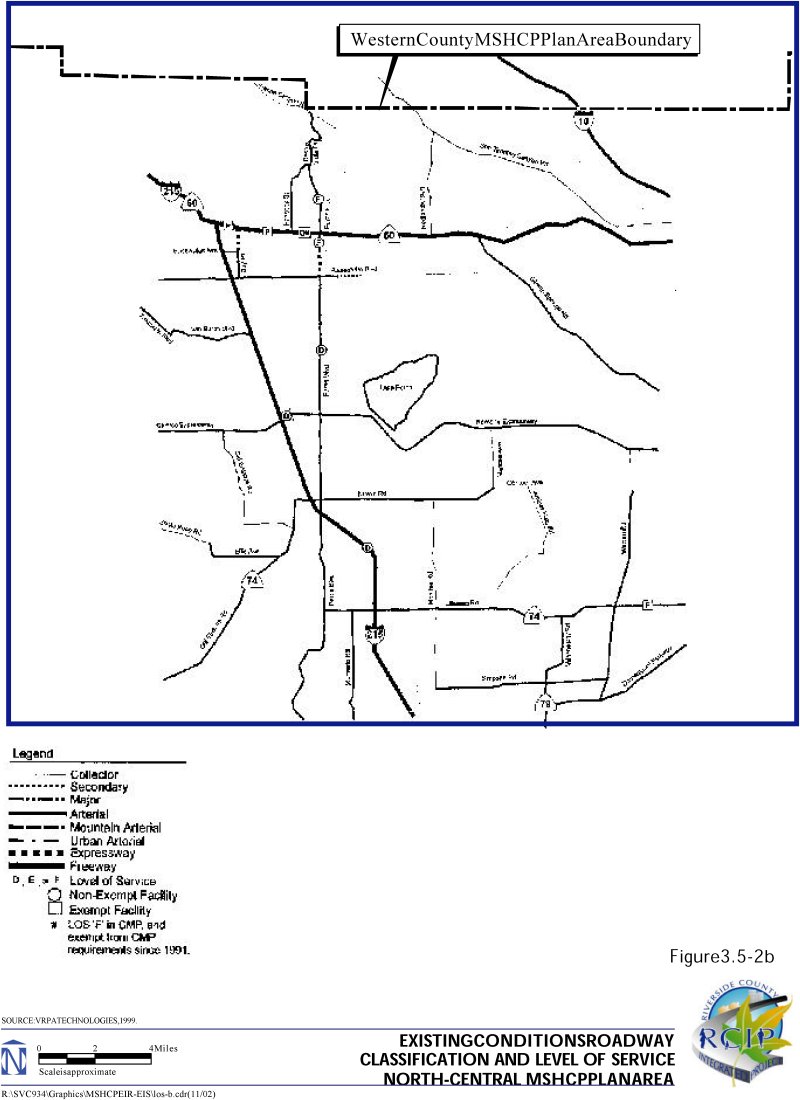
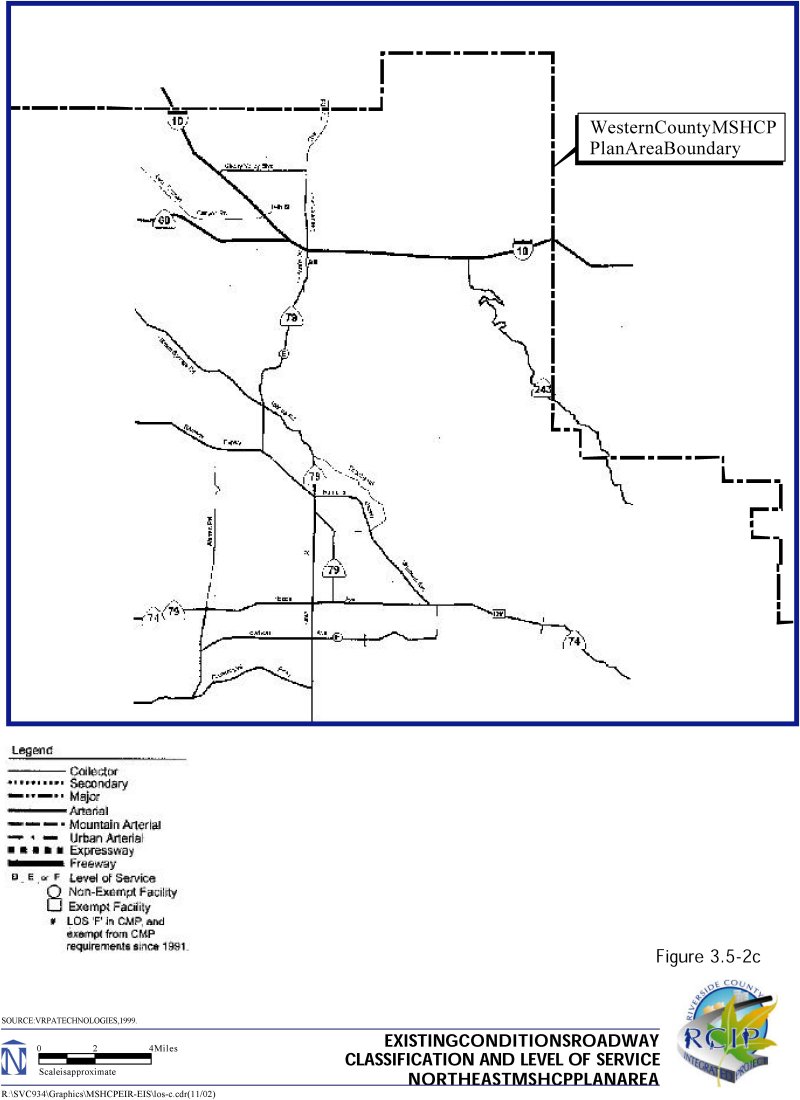
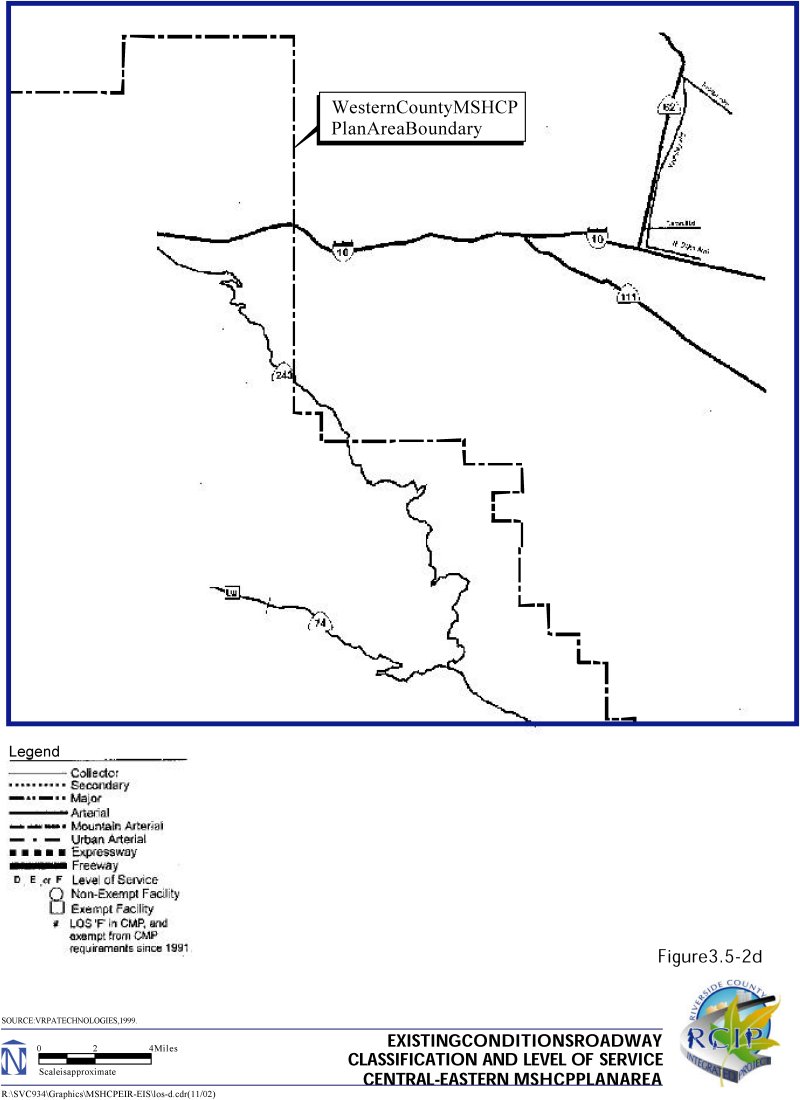
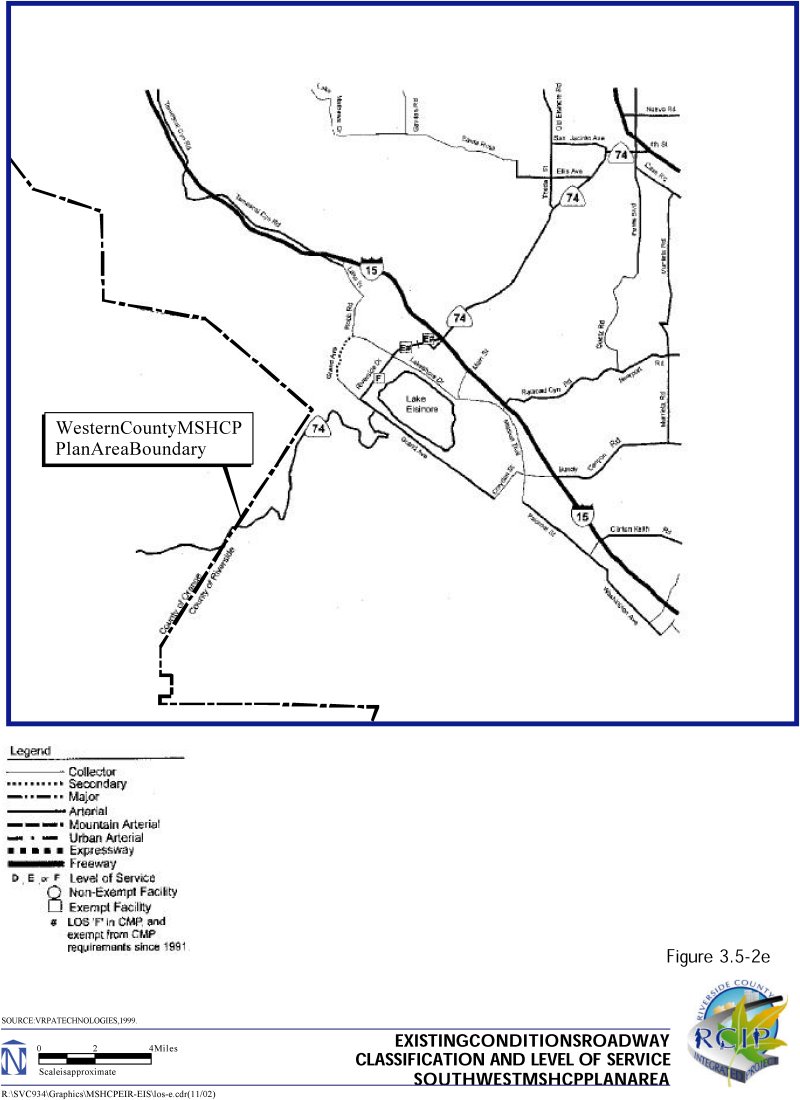
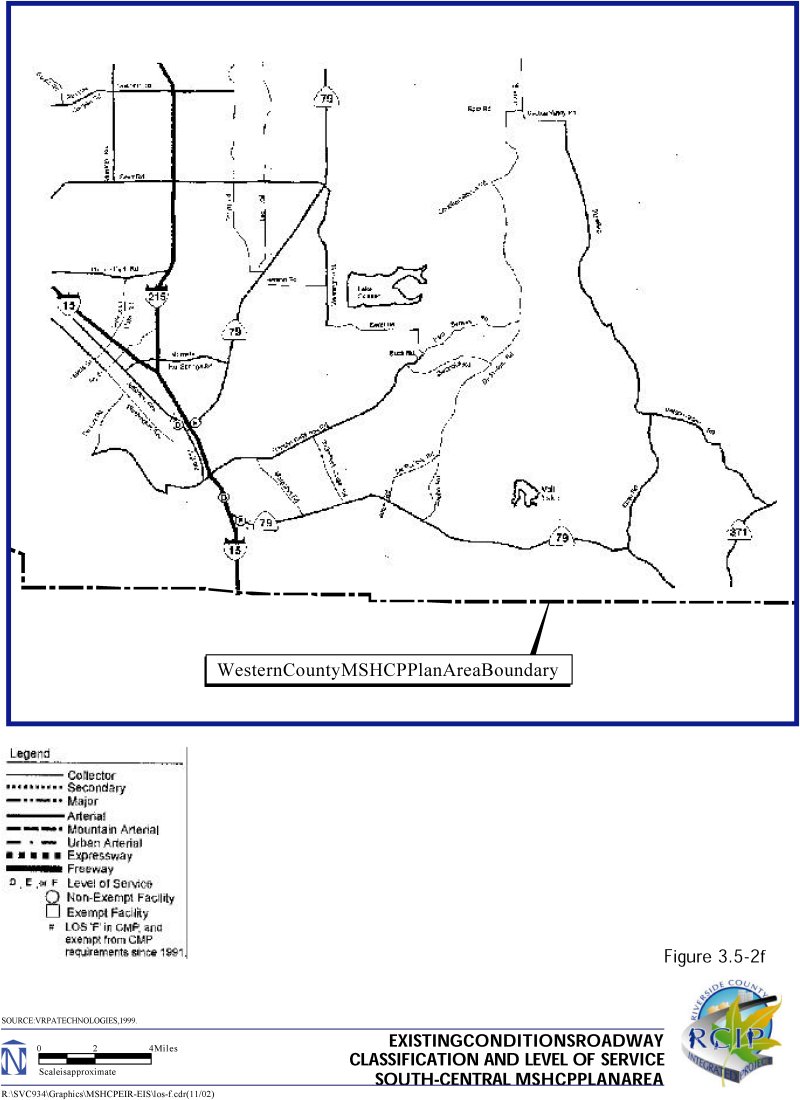
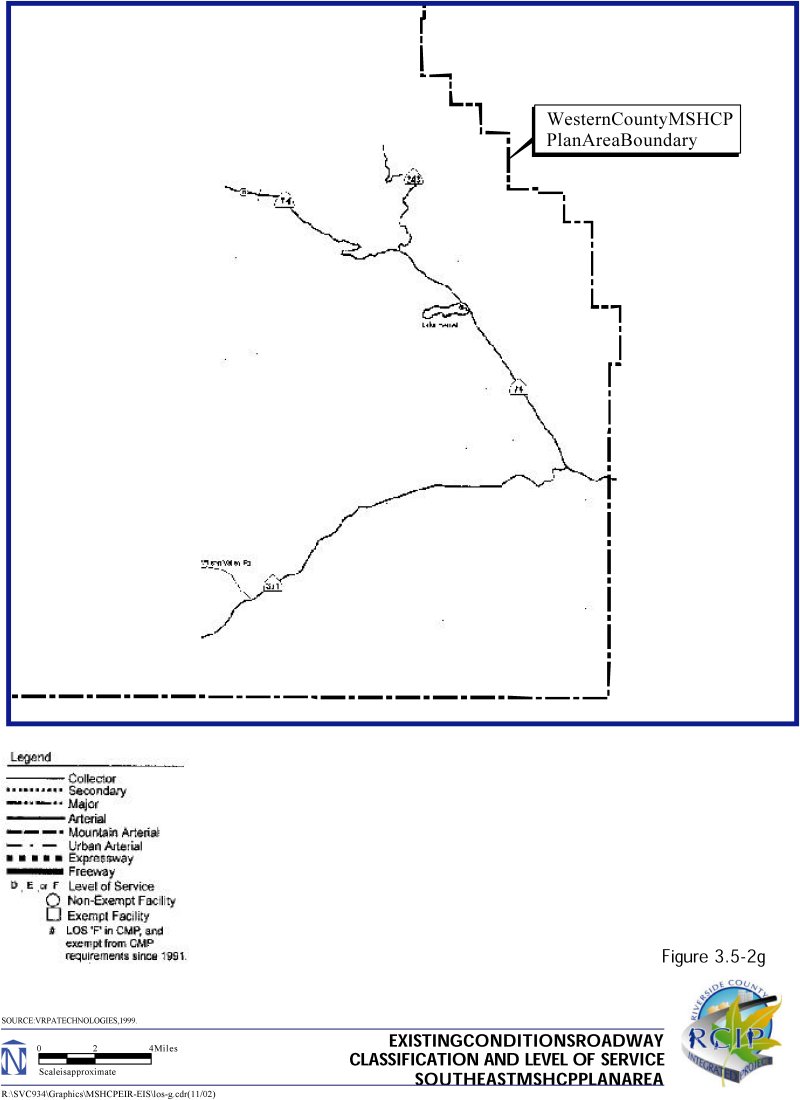
| Table 3U - Existing Roadway Capacity Analysis (Interstate and State Routes) | |||||
|---|---|---|---|---|---|
| Roadway Segment | Limits | Existing Conditions (1999) | |||
| Facility Type | No. of Lanes | ADT | LOS | ||
| I-15 | Temecula, Jct. SR-79 - Jct. I-215 North | Freeway | 8 | 131,600 | D |
| Corona, Magnolia Avenue - Corona, Jct. SR-91 | Freeway | 8 | 130,600 | D | |
| Corona, Jct. SR-91 - Norco, 2nd Street | Freeway | 8 | 133,700 | D | |
| Norco, 2nd Street - Norco, 6th Street | Freeway | 65 | 125,500 | F | |
| Norco, 6th Street - Limonite Avenue | Freeway | 65 | 122,400 | F | |
| Limonite Avenue - Jct. SR-60 | Freeway | 6 | 111,200 | E | |
| Jct. SR-60 - San Bernardino County Line6 | Freeway | 95 | 175,500 | F | |
| Jct. SR-60 - San Bernardino County Line - Milliken Avenue | Freeway | 67 | 197,900 | F | |
| Milliken Avenue - Jct. I-15 | Freeway | 67 | 189,800 | F | |
| Jct. I-15 - Van Buren Boulevard | Freeway | 65 | 122,400 | F | |
| Van Buren Boulevard - Etiwanda Avenue | Freeway | 65 | 91,800 | C | |
| Etiwanda Avenue - Mission Boulevard | Freeway | 6 | 101,000 | D | |
| Valley Way - Rubidoux, Rubidoux Boulevard | Freeway | 47 | 89,800 | F | |
| Rubidoux, Rubidoux Boulevard - Riverside, Crestmore Avenue | Freeway | 47 | 96,900 | F | |
| Riverside, Crestmore Avenue - Riverside, Main Street | Freeway | 47 | 103,100 | F | |
| Riverside, Main Street - Riverside, Orange Street | Freeway | 47 | 98,000 | F | |
| Riverside, Orange Street - Riverside, East Jct. I-215 | Freeway | 47 | 100,000 | F | |
| Riverside, East Jct. I-215 - Riverside, Day Street | Freeway | 47 | 105,100 | F | |
| Riverside, Day Street - Moreno Valley, Pigeon Pass Road | Freeway | 47 | 108,200 | F | |
| Moreno Valley, Pigeon Pass Road - Moreno Valley, Heacock Street | Freeway | 47 | 83,700 | F | |
| Moreno Valley, Heacock Street - Moreno Valley, Perris Boulevard | Freeway | 48 | 68,400 | D | |
| SR-71 | Riverside County Line - Jct. SR-91 | Arterial | 27 | 33,700 | F |
| SR-74 | Elsinore, Grand Avenue - Elsinore, Lake Shore Drive | Arterial | 27 | 20,100 | F |
| Elsinore, Lake Shore Drive - Gunnerson Street/Strickland Avenue | Arterial | 28 | 17,200 | E | |
| Gunnerson Street/Strickland Avenue - Elsinore, Jct. I-15 | Arterial | 28 | 17,600 | E | |
| Elsinore, Jct. I-15 - Perris Seventh Street | Arterial | 2 | 16,400 | E | |
| Perris Seventh Street - Perris, D Street | Arterial | 2 | 16,900 | E | |
| Hemet, Lyon Avenue - Hemet, State Street | Arterial | 48 | 29,100 | D | |
| Hemet, State Street - Hemet, Jct. SR-79 North, San Jacinto Street | Arterial | 48 | 30,600 | D | |
| SR-79 | Sage Road - Temecular, Pala Road | Arterial | 28 | 18,200 | F |
| Temecula, Pala Road - South Jct. I-15, Temecula South | Arterial | 28 | 30,100 | F | |
| Temecula, North Jct. I-15 - Borel Street | Arterial | 4 | 32,700 | E | |
| Central Avenue/State Street - Ramona Expressway | Arterial | 2 | 14,900 | D | |
| Soboba Road- California Avenue | Arterial | 2 | 14,900 | E | |
| SR-86 | Coachella, South Jct. SR-111 - Coachella, Dillon Road/Avenue 48 | Arterial | 4 | 35,200 | E |
| SR-91 | Orange County Line - Green River Drive | Freeway | 87 | 228,500 | F |
| Green River Drive - Jct. SR-71 North | Freeway | 87 | 220,400 | F | |
| Jct. SR-71 North - Serfas Club Drive | Freeway | 87 | 219,300 | F | |
| Serfas Club Drive - Corona, Maple Street | Freeway | 87 | 222,400 | F | |
| Corona, Maple Street - Corona, Lincoln Avenue | Freeway | 87 | 215,300 | F | |
| Corona, Lincoln Avenue - Corona, West Grand Boulevard | Freeway | 87 | 226,500 | F | |
| Corona, West Grand Boulevard. - Corona, Main Street | Freeway | 87 | 219,300 | F | |
| Corona, Main Street - Jct. I-15 | Freeway | 87 | 235,700 | F | |
| Jct. I-15 - McKinley Street | Freeway | 87 | 211,200 | F | |
| McKinley Street - Pierce Street | Freeway | 87 | 185,700 | F | |
| Pierce Street - Magnolia Avenue | Freeway | 87 | 163,200 | F | |
| Magnolia Avenue - La Sierra Avenue | Freeway | 87 | 168,300 | F | |
| La Sierra Avenue - Tyler Street | Freeway | 87 | 166,300 | F | |
| Tyler Street - Van Buren Boulevard | Freeway | 87 | 170,400 | F | |
| Van Buren Boulevard - Adams Street | Freeway | 87 | 162,200 | F | |
| Adams Street - Madison Street | Freeway | 87 | 165,300 | F | |
| Madison Street - Arlington Avenue | Freeway | 87 | 165,300 | F | |
| Arlington Avenue - Central Avenue/State Street | Freeway | 87 | 168,300 | F | |
| Central Avenue/State Street - Fourteenth Street | Freeway | 87 | 168,300 | F | |
| Fourteenth Street - Eighth Street | Freeway | 87 | 167,300 | F | |
| Eighth Street - LaCadena Drive/Poplar and Spruce Streets | Freeway | 87 | 162,200 | F | |
| LaCadena Drive/Poplar and Spruce Streets Jct. SR-60, Jct. I-215 North | Freeway | 87 | 160,200 | F | |
| SR-111 | Washington Street - Racquet Club Drive | Arterial | 4 | 31,100 | D |
| Racquet Club Drive - Miles/Manitou Avenue | Arterial | 4 | 31,100 | D | |
| Miles/Manitou Avenue - Cook Street | Arterial | 4 | 30,700 | D | |
| Cook Street - Indian Wells City Limits | Arterial | 4 | 31,200 | D | |
| Indian Wells City Limits - Portola Avenue | Arterial | 48 | 31,200 | D | |
| Portola Avenue - Jct. SR-74 South | Arterial | 47 | 39,500 | F | |
| Jct. SR-74 South - Bob Hope Drive | Arterial | 47 | 33,800 | F | |
| Bob Hope Drive - Country Club Drive (40th Avenue) | Arterial | 48 | 36,400 | E | |
| Country Club Drive (40th Avenue) - Frank Sinatra Drive | Arterial | 47 | 38,500 | F | |
| Frank Sinatra Drive - Date Palm Avenue/Broadway | Arterial | 47 | 40,100 | F | |
| Date Palm Avenue/Broadway - Golf Club Drive | Arterial | 47 | 41,600 | F | |
| Golf Club Drive - Gene Autry Trail | Arterial | 47 | 42,700 | F | |
| I-215 | South Jct. SR-74, Case Road - North Jct. SR-74; Fourth Street | Freeway | 4 | 61,200 | D |
| Jct. SR-60 East - Fair Isle Drive | Freeway | 67 | 174,800 | F | |
| Fair Isle Drive - Central Avenue | Freeway | 67 | 180,000 | F | |
| Central Avenue - Pennsylvania Avenue | Freeway | 67 | 174,800 | F | |
| Pennsylvania Avenue - University Avenue | Freeway | 67 | 173,700 | F | |
| University Avenue - 3rd/Blaine Street | Freeway | 67 | 172,000 | F | |
| 3rd/Blaine Street - Spruce Street | Freeway | 87 | 177,900 | F | |
| Spruce Street - Jct. SR-60 and SR-91 West | Freeway | 87 | 178,900 | F | |
| Jct. SR-60 and SR-91 West - Columbia Avenue | Freeway | 88 | 151,900 | E | |
| Columbia Avenue - Center Street | Freeway | 67 | 147,700 | F | |
| Center Street - San Bernardino County Line | Freeway | 67 | 143,600 | F | |
| Notes: 1 Referenced from SCAG RIVSAN/CTP Base Year Model or CVAG CVATS Base Year Model. 2 Referenced from SCAG RIVSAN/CTP Base Year Model or CVAG CVATS Base Year Model. 3 Referenced from Riverside County GIS System - Traffic Count Database or from CVAG Manual or from Caltrans Count Manual. 4 Derived by VRPA Technologies. 5 Not exempt from CMP Requirements. 6 I-15: Jct. Rte 60 - San Bernardino Co. Line - Analyzed as a 9-lane Freeway. All counts increased 2 percent per year to reflect 1999 Conditions. 7 Exempt from CMP requirements because the facility segment has been LOS F since 1991. 8 Currently undergoing roadway improvements. Resultant roadway improvement should improve Level of Service. |
|||||
| Table 3V - Existing Roadway Capacity Analysis (Classified Local Facilities1) | |||||
|---|---|---|---|---|---|
| Roadway Segment | Limits | Existing Conditions (1999) | |||
| Facility Type | No. of Lanes | ADT | LOS | ||
| 44th Avenue | Washington Street - Clinton Street | Arterial | 4 | 32,000 | D |
| Alessandro Boulevard | Frederick Street - Heacock Street | Arterial | 4 | 33,100 | E |
| Alessandro Boulevard | Overlook Pkwy - Trautwein | Arterial | 4 | 30,700 | D |
| Arlington Avenue | Adams - Magnolia Avenue | Arterial | 4 | 34,300 | E |
| Arlington Avenue | Victoria Avenue Chicago Avenue | Arterial | 4 | 29,500 | D |
| Chicago Avenue | Central Avenue - Alessandro Boulevard | Arterial | 4 | 30,000 | D |
| Gene Autry Trail | I-10 - Palm Springs Bypass | Arterial | 2 | 14,900 | D |
| Gene Autry Trail | Palm Springs Bypass - Vista Chino | Arterial | 2 | 15,200 | D |
| Indiana Avenue | Cajalco Street - Fillmore Street | Collector | 25 | 13,700 | F |
| Jefferson Avenue | Winchester Avenue - Date Street | Arterial | 2 | 14,600 | D |
| La Sierra Avenue | Arlington Avenue - Gramercy Avenue | Arterial | 26 | 27,900 | F |
| La Sierra Avenue | Magnolia Avenue - SR-91 | Arterial | 4 | 28,800 | D |
| Limonite Avenue | I-15 - Etiwanda Avenue | Arterial | 2 | 17,100 | E |
| Limonite Avenue | Etiwanda Avenue - Bain Street | Arterial | 2 | 17,500 | E |
| Magnolia Avenue | SR-91 - La Sierra Avenue | Arterial | 4 | 32,200 | D |
| Magnolia Avenue | Harrison Street - Van Buren Boulevard | Arterial | 4 | 29,000 | D |
| Magnolia Avenue | Van Buren Boulevard Arlington Avenue | Arterial | 4 | 30,300 | D |
| Magnolia Avenue | Arlington Avenue - 7th Street | Arterial | 4 | 35,100 | E |
| Monterey Avenue | Frank Sinatra Drive - SR-111 | Arterial | 4 | 28,900 | D |
| Palm Drive | Two Bunch Palms Trail - Dillon Road | Arterial | 25 | 22,600 | F |
| Palm Drive | Dillon Road - Varner Road | Arterial | 2 | 17,600 | E |
| Palm Drive | Varner Road - I-10 | Arterial | 2 | 17,600 | E |
| Perris Boulevard | Reche Vista Drive - SR-60 | Arterial | 25 | 32,900 | F |
| Perris Boulevard | SR-60 - Eucalyptus Avenue | Arterial | 4 | 33,300 | E |
| Perris Boulevard | Alessandro Boulevard - Cajalco Expressway | Arterial | 4 | 28,900 | D |
| Ramon Road | Gene Autry Trail - Da Vall Drive | Arterial | 4 | 31,300 | D |
| Ramon Road | Da Vall Drive - Bob Hope Drive | Arterial | 26 | 20,100 | F |
| Ramona Expressway | I-215 - Patterson Avenue | Arterial | 4 | 31,000 | D |
| San Jacinto | Main Street - Commonwealth Avenue | Arterial | 2 | 17,700 | E |
| San Jacinto | Menlo Avenue - Florida Avenue | Arterial | 25 | 36,000 | F |
| Stetson Avenue | State Avenue - Stanford Street | Arterial | 2 | 16,400 | E |
| Van Buren Boulevard | Washington Street - Wood Road | Arterial | 4 | 34,600 | E |
| Van Buren Boulevard | Limonite Avenue - Jurupa Avenue | Arterial | 47 | 31,200 | D |
| Van Buren Boulevard | Jurupa Avenue - Arlington Avenue | Arterial | 47 | 31,200 | D |
| Van Buren Boulevard | Arlington Avenue - Magnolia Avenue | Arterial | 4 | 31,800 | D |
| Van Buren Boulevard | Magnolia Avenue - SR-91 | Arterial | 4 | 30,800 | D |
| Notes: 1 Identified by VRPA Technologies to reflect Existing Conditions on a "regional basis." 2 Referenced from SCAG RIVSAN/CTP Base Year Model or CVAG CVATS Base Year Model. 3 Referenced from SCAG RIVSAN/CTP Base Year Model or CVAG CVATS Base Year Model. 4 Referenced from Riverside County GIS System - Traffic Count Database, CVAG Traffic Count Manual or Caltrans Traffic Count Manual. All counts increased 2 percent per year to reflect 1999 Conditions. 5 Not on the CMP System. 6 Exempt from CMP requirements. The facility segment has been LOS F since 1991. 7 The CMP has identified this segment as LOS F and exempt from CMP requirements since 1991. The LOS shown in this table may differ from the LOS reported in the CMP. This can occurr because the CMP is based on a different methodology than this table (peak hour analysis versus AADT) or because lanes have been added to the facility since the time it was declared to be exempt (1991). |
|||||
3.5.3 Existing Public Transportation Systems/Services
Fixed-route transit services and demand response (dial-a-ride) transit services are provided by the Riverside Transit Agency (RTA) for the western portion of Riverside County and by SunLine Transit in the Coachella Valley.
Riverside Transit Agency
The RTA was formed in March of 1977 through a Joint-Powers Agreement (JPA) between the County of Riverside and the incorporated cities within its service area. Currently, RTA operates 29 fixed bus routes providing public transit service throughout a 2,500-square mile area of western Riverside County. RTA's fixed routes have been designed to establish transportation connections between all the cities and unincorporated communities in western Riverside County. A Riverside Transit Agency System Map brochure has been included in Appendix A, which shows all the fixed routes, route connection and transfer locations, and demand response system service areas. The brochure also includes helpful hints for using the system, an explanation of rider fares, and instructions on the use of bike racks. RTA also participates with OmniTrans in San Bernardino County to provide express bus service between downtown Riverside and downtown San Bernardino, connecting with express service to Ontario.
RTA is currently operating 76 full-size buses, 67 mini-buses and vans, and two trolleys. The system carries approximately 6.4 million passengers annually, which is about 18,000 passengers per day. All of the RTA's vehicles are wheelchair accessible and all full-size buses include bike racks. RTA was the nation's first transit agency to own and operate EPA-approved, methanol-powered buses, and has recently added several buses that operate on Compressed Natural Gas (CNG). Overall, the rolling stock fleet now includes 20 buses operating on alternative fuels. To provide the necessary fuel services, RTA has recently purchased an on-site CNG fueling station.
RTA currently utilizes several types of media and methods to share or distribute information about the transit services. The agency prints a Ride Guide, that includes fare schedules, route maps, and other rider information, as well as a multi-color RTA System Map.
SunLine Transit
SunLine Transit Agency (SunLine) was formed in 1977 through a JPA between the County of Riverside and a number of the Coachella Valley cities. The purpose of the JPA was to provide public transit services for the Coachella Valley area. The JPA currently includes the County of Riverside, and the Cities of Desert Hot Springs, Palm Springs, Cathedral City, Rancho Mirage, Palm Desert, Indian Wells, La Quinta, Indio, and Coachella. The service area covers 928 square miles with a permanent population of over 270,000 residents. Due to the desirable climate and an economy largely based on tourism, the population fluctuates by another 200,000 seasonal residents, and additional national and international visitors.
SunLine operates 13 fixed routes, with more than 700 stop locations, serving over three million passengers annually. The agency currently operates a fleet of 40 buses, all of which operate on CNG. SunLine was the first transit agency in the nation to operate a 100 percent CNG fleet of vehicles. The agency also operates two CNG fueling facilities, one in Thousand Palms and one in Indio.
All of SunLine's buses are equipped with front-mounted bicycle racks, and overall the system is carrying over 6,000 bicycles per month. While the SunLine system of fixed route transit stops are not currently 100 percent Americans with Disabilities Act (ADA) accessible, the agency has established an ACCESS Committee to review service plans and policies and to make recommendations to staff regarding ADA issues. The SunLine system provides transportation services to an average of 900 wheelchair passengers per month.
SunLine also operates the SunDial System, which provides curb-to-curb demand responsive (dial-a-ride) service for members of the community requiring such assistance. The SunDial fleet includes 19 vehicles and serves over 40,000 passenger trips annually.
Other Specialized Transit Services
In addition to fixed route and demand-responsive services provided by RTA and SunLine, specialized public transportation services are also available through services operated by four municipal operators - the City of Riverside, City of Corona, City of Banning, and City of Beaumont. Additionally, the RCTC supports a number of specialized transportation programs including shared ride car and vanpool services, social service dial-a-ride, and specialized services for seniors and persons with disabilities.
Common Carriers
Greyhound Bus Lines provides private transportation services that link the principal population centers of the County with other regions. This includes east-west service connecting Blythe, Indio, Palm Springs, Banning/Beaumont, and Riverside (via San Bernardino). The service continues westward to downtown Los Angeles and intermediate stops. North-south service connects Riverside with Temecula, continuing southward to San Diego. The number of bus trips in each direction ranges from five to eight per day.
Intermodal Coordination
RTA, SunLine, OmniTrans in San Bernardino County, the Orange County Transportation Authority (OCTA), and each of the city transit service providers coordinate their respective schedules and transfer stops to provide for an enhanced level of transit service. RTA's main terminal in Riverside is located between University Avenue and Mission Inn Avenue, one block west of Market Avenue. Transfer points in other areas are indicated on the RTA transit map. RTA also provides connections to selected Metrolink stations for both inbound and outbound trains.
3.5.4 Existing Rail Transportation System
Inter-City Passenger Rail
The only AMTRAK station located in Riverside County is in the City of Palm Springs. This station provides connecting AMTRAK service to points west including Los Angeles and to points east including Tucson, Arizona, and El Paso, Texas. AMTRAK provides bus connections to and from other Riverside County areas to the San Bernardino AMTRAK station on a daily basis. RTA bus service is provided from downtown Riverside to downtown San Bernardino; however, a transfer is needed to get to the AMTRAK station. There is also an Amtrak stop in Palm Springs at Indian Canyon Drive (extension of Indian Avenue South) at Amado Road. Amtrak motor coaches and SunLine transit use the Sun Bus stop on the east side of Indian Canyon Drive.
Commuter Rail
Commuter rail in the Southern California region has significantly grown along the Metrolink system from 940,000 riders per year in Fiscal Year (FY) 1992-1993 (with four operating commuter rail lines), to 4.2 million passengers per year in FY 1994-1995. In FY 1996-1997 almost 6 million riders chose Metrolink with six major commuter rail corridors in service. During that same period, the Riverside Line increased from 133,000 passengers in FY 1992-1993 to 927,000 passengers in FY 1996-1997.
Over the next 20 years, MetroLink is expected to increase to 169 daily trains and 50,400 daily riders (almost $0.6 billion in capital investment) on all lines to maximize use of commuter rail in the Southern California region. The increased service may be supported by the introduction of demand response feeder systems. System improvements are consistent with the Southern California Regional Rail Authority's long-term plan. The long-term plan calls for extension of the Riverside Transit Corridor, in accordance with performance standards, along the San Jacinto branch line to the City of Hemet.
High-Speed Rail
A regional high speed rail system is proposed that will connect major regional activity centers and significant inter-/multi-modal transportation facilities in Los Angeles, Orange, Riverside and San Bernardino Counties by year 2020. This system would also provide connection to the San Diego region, and connect with the proposed high-speed rail system in Northern California. On July 21, 1999, the California High Speed Rail Authority adopted a plan for an Inland route for the system. This would include stops at Ontario Airport, Riverside, and Temecula; however, the Authority indicated that it would continue to consider an alternative route through Orange County. Cost and ridership estimates will be prepared to further investigate the system's feasibility.
3.5.5 Existing Non-Motorized Systems
Bicycling
Bicycling occurs throughout the County, but is more concentrated in the cities, and is more recreational than commute-oriented. The current bicycle element provides for connections between major urban and recreational facilities within the County; however, implementation of the plan has occurred only to a limited extent. One of the major regional bikeway paths is located along the Santa Ana River, which has been completed from the Orange/Riverside County boundary to downtown Riverside. In addition to the bicycle element, local agencies have adopted bicycle facility plans focusing on safe bicycle routes to schools and other community facilities.
California Vehicle Code (Section 21200[a]) states that every person riding a bicycle upon a highway has all the rights and is subject to all the provisions applicable to the driver of a vehicle. While bicycles are permitted on most roads in Riverside County, many people will not consider a bicycle as a means of transportation unless some accommodation has been made for their safety and convenience. In order to entice these prospective bicycle riders, a variety of bicycle facility types are necessary. The term "bikeway" means all facilities that provide for bicycle travel. There are three types of bikeway classifications: Class 1, which are off-road, paved paths; Class 2, which are onroad, signed and striped bicycle lanes; and Class 3, which are on-road, signed bicycle routes with no separate lanes.
Investment in bikeways provides an inexpensive environment-friendly transportation opportunity. Bicycle usage will continue to offer important relief to congested roadways, provide air quality benefits, and reduce energy consumption. Bicycling is considered an effective alternative mode of transportation that can help to improve air quality and reduce the number of vehicles traveling along existing highways, especially within the cities and unincorporated communities; however, the numbers of cyclists is small in comparison to the amount of auto traffic.
A number of barriers currently impede the increased usage of bicycles as an alternative non-motorized mode of travel. These barriers include negative perceptions about nonmotorized commuting; unsafe, insufficient, and inconvenient bikeways; and crime, including personal and bicycle safety and security. Given the favorable climate for cycling most of the year, overcoming these institutional barriers would help increase the ridership of bicyclists throughout the County.
Pedestrian Facilities
Pedestrian facilities within the immediate vicinity of schools and recreational facilities are also important components of the non-motorized transportation system. Pedestrian circulation facilities within and around school and recreational areas, in the form of sidewalks built to current County standards, are provided where they are appropriate and enhance the safety of those who choose to walk to and from their destinations.
For the most part, sidewalks are installed in more urban environments, when the roadway frontage is developed. Because development occurs in stages, numerous missing links can occur in the sidewalk system. Eventually these are filled in, but this can sometimes take many years.
Equestrian Trails
There are a number of equestrian trails located in the rural and semi-urban areas of the County. Large lot developments in the County allow for the care and use of horses. A consideration during preparation of this Circulation Element Update will be to identify appropriate locations and standards for equestrian trail development.
3.5.6 Major Utility Corridors
The major conveyance lines for water, natural gas, and electricity transmission systems form a substantial network of corridors crossing Riverside County. These major utility transmission lines are shown in Figure 3.5.3. The locations of these transmission lines were obtained from information and maps provided by the Metropolitan Water District (MWD) of Southern California and the State of California Energy Commission. There is a concentration of major water, gas, and electrical utility corridors along I-10 through the desert and San Gorgonio Pass. Additional corridors are created along the routes of the other major utility transmission lines as shown in Figure 3.5.3.
Major Water Pipelines and Aqueducts
Major water conveyance systems consist of the Colorado River Aqueduct operated by the MWD of Southern California, the California Aqueduct operated by the State Department of Water Resources (DWR), and water distribution lines operated by MWD.
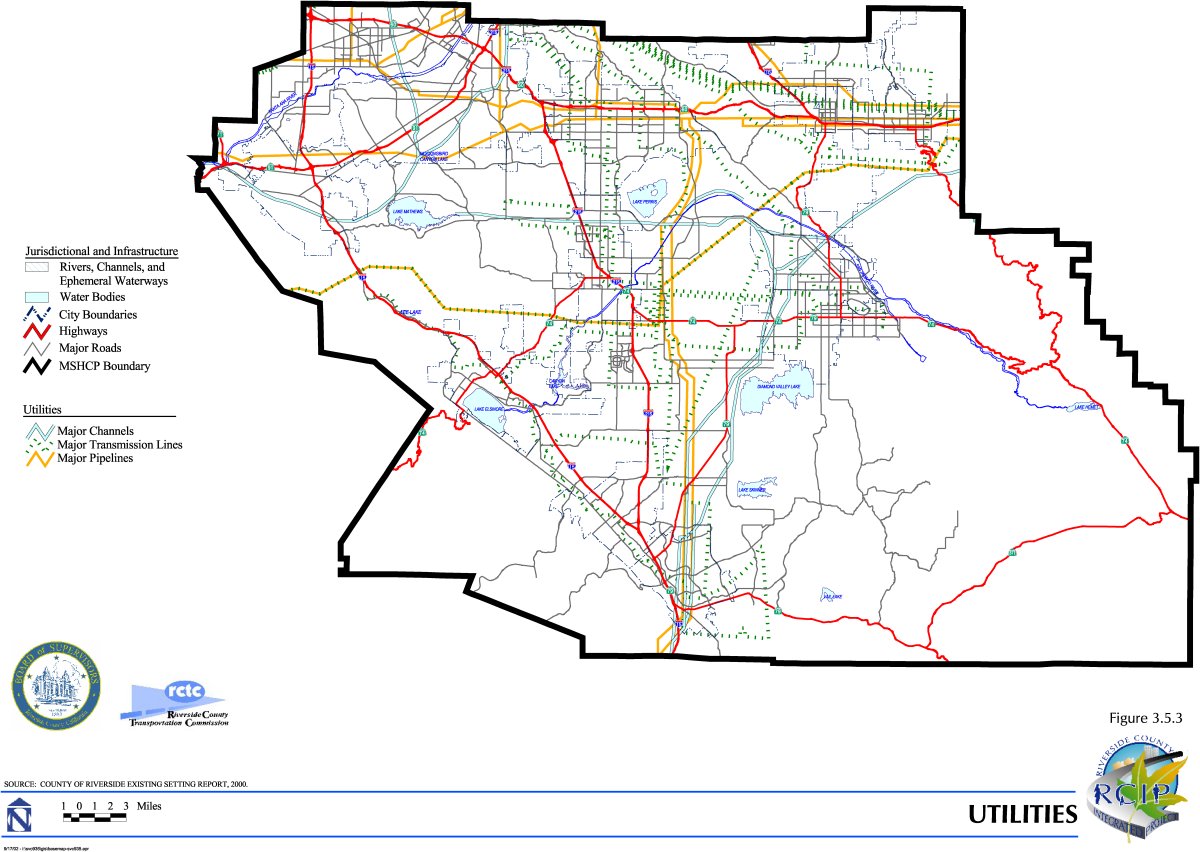
The starting point of the Colorado River Aqueduct is in San Bernardino County. The aqueduct extends north-south as it enters Riverside County near the intersection of SR62 and SR-177 and continues southerly towards Desert Center. The Colorado River Aqueduct generally follows I-10 east-west across the County from Desert Center to the San Gorgonio pass near Cabazon. At that point, the aqueduct veers to the south of I-10 and extends towards San Jacinto before terminating at Lake Mathews. Part of California's State Water Project (SWP), the California Aqueduct terminates in Riverside County at Lake Perris. Lake Perris is the southernmost storage location within the SWP.
Figure 3.5.3 also shows the major water distribution system lines in Riverside County operated by MWD. These lines are the primary water transmission pipelines conveying water from storage locations to the eventual end user.
Major Natural Gas Pipelines
Most of the major natural gas transmission pipelines in Riverside County are operated by the Gas Company. As shown in Figure 3.5.3, the Gas Company operates three major pipelines extending east to west through Riverside County. These main pipelines follow I-10 through most of the county. Dual pipelines branch off these main lines near Desert Center and extend southward into Imperial County and another set of dual lines branch off the main pipelines near Gilman Springs Road at SR-60 and extend southward into San Diego County. Near the I-215 interchange, one pipeline veers to the south and extends west across the county following SR-91. Another veers to the north and follows I-215 before extending west across the County through the City of Riverside and Pedley. Additional Gas Company pipelines extend north-south in the western portion of Riverside County, providing system connectivity to west San Bernardino Valley and the upper desert region in San Bernardino County as shown in Figure 3.5.3.
Near Desert Center, an additional natural gas transmission line extends northward from the main pipelines following the I-10 corridor. This pipeline follows Kaiser Road before terminating near Eagle Mountain. A separate pipeline operated by Imperial Irrigation District extends north from MWD's Eagle Mountain water pumping plant and terminates near the intersection of SR-62 and SR-177.
Major Electrical Transmission Lines
Major electricity transmission lines in Riverside County are operated by Southern California Edison (SCE) and Imperial Irrigation District. Major electricity transmission lines are those that carry a minimum of 220 kilovolts (kV) of power, and are shown in Figure 3.5.3.
SCE operates a 500 kV transmission line extending east-west through most of Riverside County. The 500 kV line follows the I-10 corridor from the Arizona border west to the San Gorgonio pass area, veers south of I-10 towards Perris, and then extends west from Perris into Orange County. From the San Gorgonio Pass area, multiple 220 kV lines veer north of I-10 and follow San Timoteo Canyon into Redlands in San Bernardino County. Portions of SCE's 220 kV transmission lines pass through the northwest corner of Riverside County.
MWD operates a 220 kV transmission line extending from its Hinds water pumping plant located along I-10 west of Desert Center to its Iron Mountain pumping plant located in San Bernardino County north of the intersection of SR-62 and SR-177.