

Nexus Report
1. INTRODUCTION
1.1. PURPOSE OF THE MITIGATION FEE NEXUS REPORT
1.2. PARTICIPATION IN PREPARATION OF THIS FEE NEXUS REPORT
1 With, K. and A. King. 1999. Extinction Thresholds for Species in Fractal Landscapes. Conservation Biology: 314-326.
1.3. ORGANIZATION OF THE MITIGATION FEE NEXUS REPORT
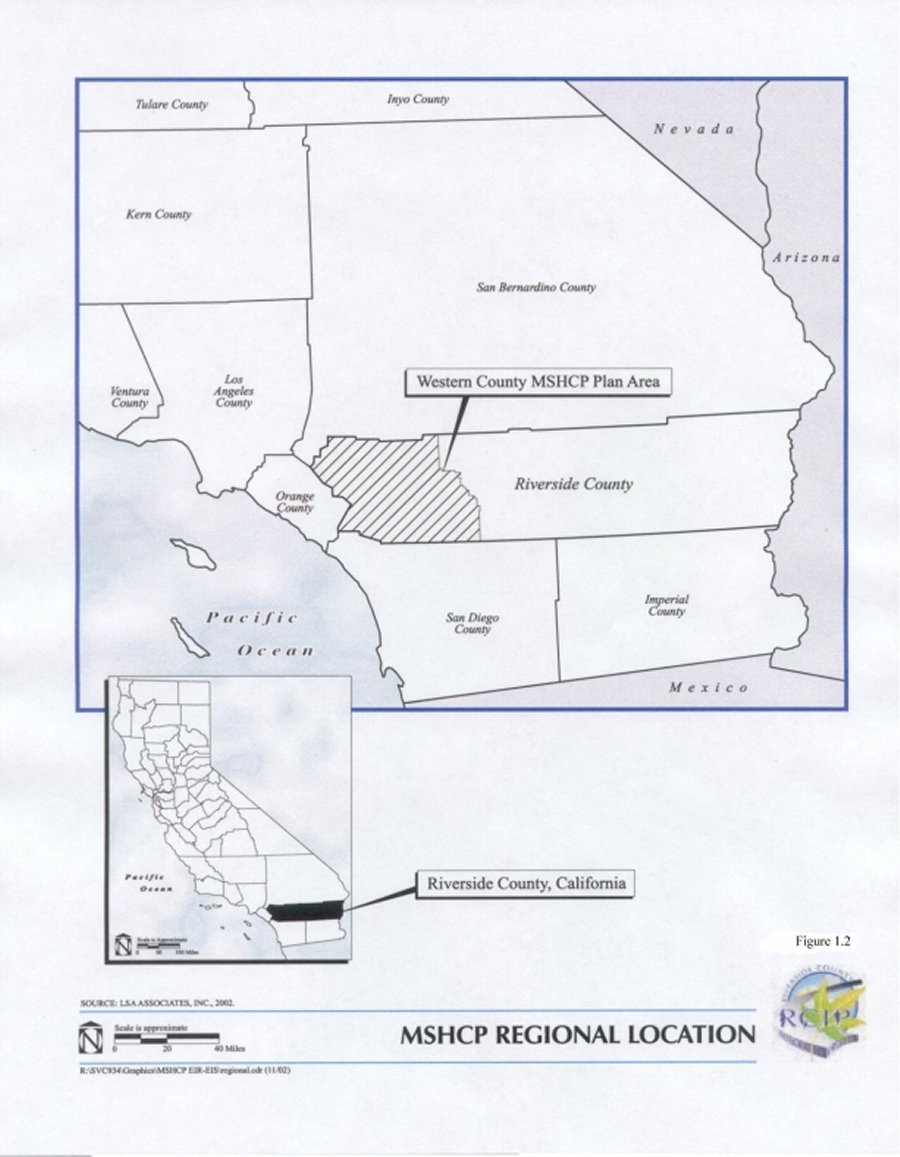
1.4. RIVERSIDE COUNTY
1.5. RIVERSIDE COUNTY GROWTH TRENDS
2 County of Riverside General Plan, Housing Element, page H-78
3 United States Census Bureau, Census 2000, American Fact Finder Summary File
1.5.1 RIVERSIDE COUNTY INTEGRATED PROJECT
4 Draft MSHCP Volume IV, Draft EIR/EIS, November 15, 2002
5 The August 2002 Hearing Draft of the Riverside County General Plan was used in this Nexus Report.
1.6. RECOMMENDED FEE AMOUNTS
| Table 1-1 - Summary of Local Development Mitigation Fee Amounts Derived in Section 4* | ||||
|---|---|---|---|---|
| Land Use Category | Gross Acreage* | Density | Equivalent Dwelling Unit (EDU) | Equivalent Benefit Unit (EBU) |
| Residential, density less than 8 dwelling units per acre** | $9,492 /gross acre | $2,414 /DU*** | $2,231 /DU*** | $2,354 /DU*** |
| Residential, density between than 8.1 and 14.0 dwelling units per acre dwelling units per acre | $9,492 /gross acre | $965 /DU*** | $1,785 /DU*** | $1,506 /DU*** |
| Residential, density greater than 14.1 dwelling units per acre dwelling units per acre | $9,492 /gross acre | $8,208 /gross acre | $14,502 /gross acre | $859 /DU*** |
| Commercial Development | $9,492 /gross acre | $8,208 /gross acre | $14,502 /gross acre | $8,004 /gross acre |
| Industrial and Business Park Development | $9,492 /gross acre | $8,208 /gross acre | $7,585 /gross acre | $8,004 /gross acre |
| *These fee amounts do not reflect the application of outside funding sources as discussed in Section 5 of the Nexus Report **Fee is imposed on a maximum of 0.5 acres for single family residential lots larger than 0.5 acres *** DU means dwelling unit | ||||
2. RIVERSIDE COUNTY INTEGRATED PROJECT (RCIP)
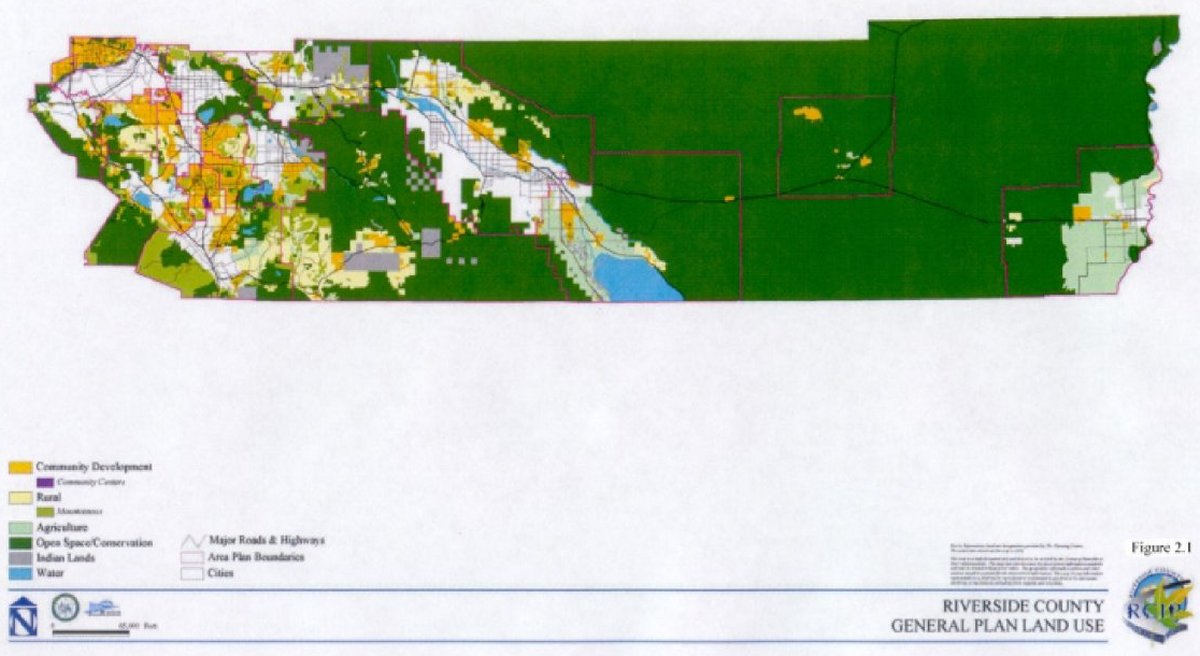
2.1. GENERAL PLAN
6 For Purposes of the Nexus Report the Public Hearing Draft of the County of Riverside General Plan, (dated April 5, 2002) was used.
7 Throughout the Nexus Report, references to the General Plan refer to the Public Hearing Draft General Plan dated April 5, 2002.
8 For a concise summary of the General Plan elements and organization please refer to page I-10 of the County of Riverside General Plan Public Hearing Draft (April 5, 2002).
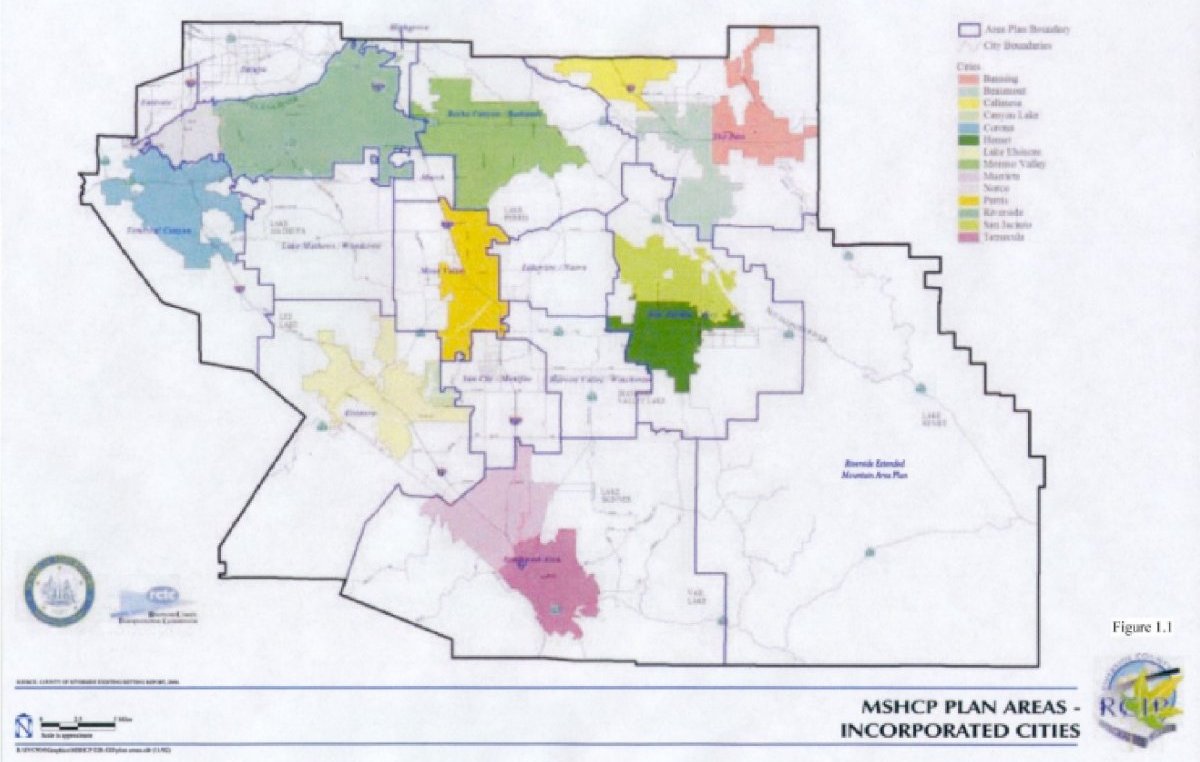
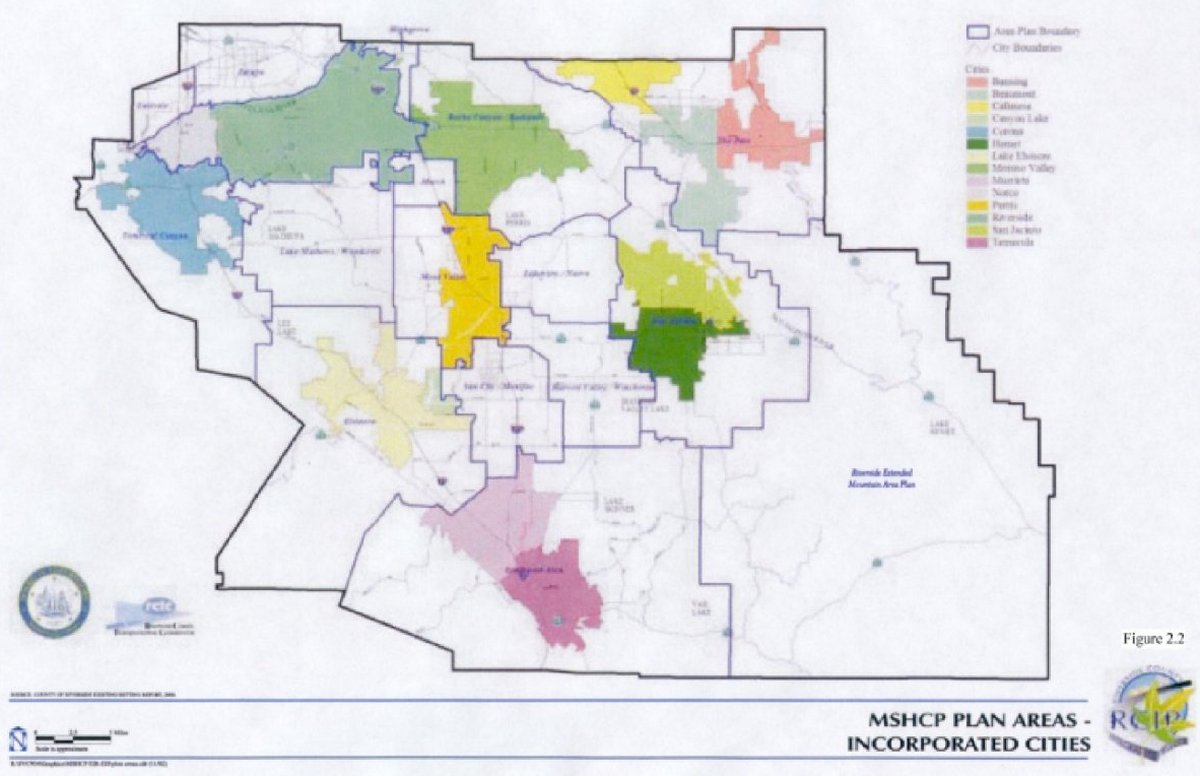
2.1.1 AREA PLANS
9 The Area Plans replace the previously adopted set of community plans plus the Riverside Extended Mountain Area Plan (REMAP) and the Southwest Area Plan (SWAP).
| Table 2-1 Riverside County Area Plans10 | ||
|---|---|---|
| Areas Plans Within Western Riverside County | ||
| Eastvale | ||
| Elsinore | ||
| Harvest Valley/Winchester | ||
| Highgrove | ||
| Jurupa | ||
| Lake Mathews/Woodcrest | ||
| Lakeview/Nuevo | ||
| Mead Valley | ||
| Reche Canyon/Badlands | ||
| Riverside Extended Mountain (REMAP) | ||
| San Jacinto Valley | ||
| Southwest (SWAP) | ||
| Sun City/Menifee Valley | ||
| Temescal Canyon | ||
| The Pass | ||
| Area Plans Within Eastern Riverside County | ||
| Desert Center | ||
| Eastern Coachella Valley | ||
| Palo Verde | ||
| Western Coachella Valley | ||
| 10 Only the western Riverside County Area Plans are within the MSHCP Plan Area. | ||
2.1.2 FOUNDATION COMPONENTS
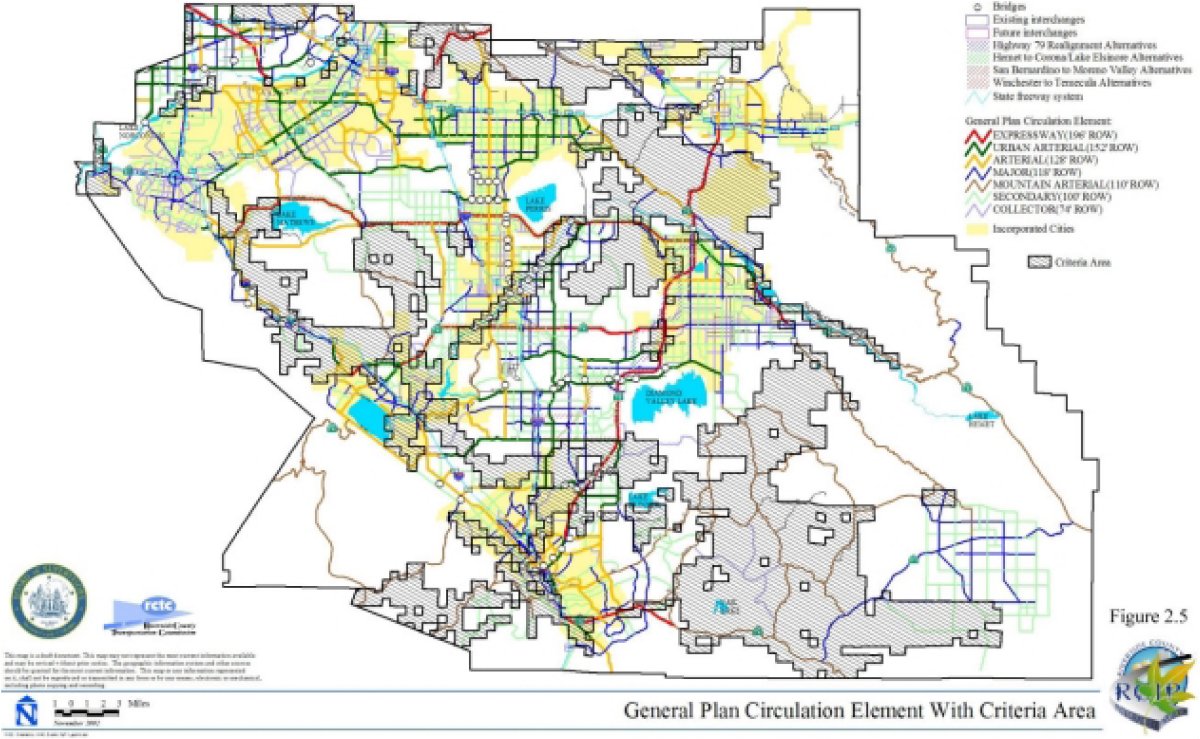
2.2. COMMUNITY ENVIRONMENTAL AND TRANSPORTATION ACCEPTABILITY PROGRAM (CETAP)
11 Refer to General Plan Chapter 3, Land Use Element for a more extensive description of the Foundation Components.
12 As discussed in Section 4, the local acquisition portion of the Additional Reserve Lands is 56,000 acres.
13 Generally a circulation element pertains only to those transportation facilities within the corporate limits of a single jurisdiction.
2.2.1 REGIONAL PLANNING CONTEXT
14 Source: Riverside County Road Department, January 30, 2003.
2.2.2 THE WINCHESTER TO TEMECULA CORRIDOR
"...provide multimodal transportation improvements that will help alleviate future traffic demands and congestion and improve the movement of people and goods between the Winchester area and the existing Interstate corridors."15
2.2.2.1. Transportation Benefits from the WT Corridor
15 Purpose and Need Statement for the Riverside County Integrated Project, Hemet to Corona/Lake Elsinore Corridor, July 13, 2001.
16 Transportation engineers describe the quality of traffic flow in terms of a "level of service" scale, from A to F. LOS A means very good traffic flow; level of service F means very poor flow.
17 Data in Table 2-2 is summarized from the "Draft Environmental Impact Statement/Draft Environmental Impact Report Winchester to Temecula corridor." July 2002, Table 4.15.B.
| Table 2-2 Daily User Benefits from WT Corridor | |||
|---|---|---|---|
| Scope | Statistic | No Build | Average of Alternate Alignments |
| Winchester-Temecula Corridor Study Area | VMT | 9,662,000 | +1.22% |
| VHT | 230,000 | -2.6% | |
| Avg. Speed | 42 mph | +3.9% | |
| Western Riverside County | VMT | 4,299,000 | +0.3% |
| VHT | 1,629,100 | -0.56% | |
| Avg. Speed | 33 mph | +0.86% | |
| Annual Benefit | NA | NA | $33.6 million |
2.2.3 THE HEMET TO CORONA/LAKE ELSINORE CORRIDOR
"…provide multimodal transportation improvements that will help alleviate future traffic demands and congestion and improve the east-west movement of people and goods across western Riverside County."18
18 Purpose and Need Statement for the Riverside County Integrated Project, Hemet to Corona/Lake Elsinore Corridor, July 31, 2001.
2.2.3.1. Transportation Benefits from the HCLE Corridor
19 Data in Table 2-3 is summarized from the "Draft Environmental Impact Statement/Draft Environmental Impact Report Hemet to Corona/Lake Elsinore Corridor", July 2002, Table 4.15.B.
| Table 2-3 Daily User Benefits from HCLE Corridor | |||
|---|---|---|---|
| Scope | Statistic | No Build | Average of Alternate Alignments |
| HCLE Corridor Study Area | VMT | 19,047,000 | +4.37% |
| VHT | 469,600 | +1.44% | |
| Avg. Speed | 41 mph | +2.9% | |
| Western Riverside County Annual Benefit | VMT | 4,299,000 | +0.83% |
| VHT | 1,629,100 | -0.62% | |
| Avg. Speed | 33 mph | +1.49% | |
| Annual Benefit | NA | NA | $37.1 million |
2.2.4 SAN BERNARDINO TO MORENO VALLEY CORRIDOR
2.2.5 ORANGE COUNTY TO RIVERSIDE COUNTY CORRIDOR
2.2.6 RELATIONSHIP BETWEEN CETAP AND MSHCP
2.3. WESTERN RIVERSIDE COUNTY Multiple Species Habitat Conservation Plan
2.3.1 INTRODUCTION TO THE MSHCP
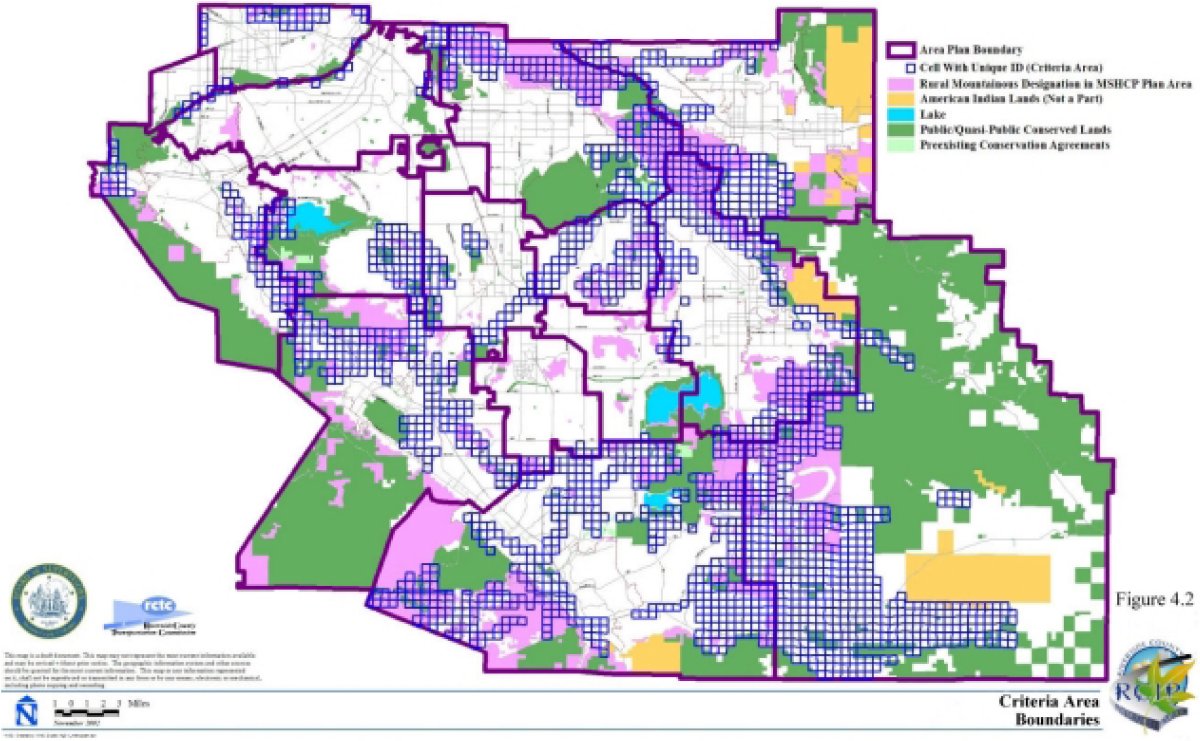
20 Each cell represents approximately 160 acres.
2.3.2 GOALS OF THE MSHCP
21 The WT and HCLE Corridors as discussed in Section 2.2.2 and 2.2.3, respectively.
22 The SBMV and OCRC Corridors as discussed in Sections 2.2.4 and 2.2.5, respectively.
2.3.3 HISTORY OF HABITAT CONSERVATION PLANS IN WESTERN RIVERSIDE COUNTY
23 The SKRHCP was completed in the Spring of 1996.
24 The document prepared pursuant to the California Natural Community Conservation Planning Act (California Fish and Game Code, Section 2800 et. seq.) to guide development of the MSHCP. A copy of said document is included in Appendix A of Volume I of the Draft MSHCP.
2.3.4 REGULATORY CONTEXT
25 Federal and state contributions shall be made as provided in the Implementing Agreement (IA) and the MSHCP.
2.3.5 CONSERVATION BIOLOGY PRINCIPLES INCORPORATED IN THE MSHCP
26 Margules, C.R. and A.O. Nicholls. 1988. Selecting networks of reserves to maximize biological diversity. Biological Conservation 43: 63-76.
27 Brown, J.H. and A. Brown-Kodric. 1977. Turnover rates in insular biogeography: Effect of immigration on extinction. Ecology 58: 445-449.
28 Ricklefs, R.E. 1993. The Economy of Nature. Third Edition. W.H. Freeman and Company. New York, NY.
29 Movement corridors are often linear and facilitate efficient movement by providing adequate cover and lack of physical obstacles for movement. Movement corridors do not provide Live-In Habitat for species.
30 Linkages, or landscape linkages, provide permanent resident Live-In Habitat, movement Habitat and are capable of sustaining a full range of community/ecosystem processes, including seed dispersal and animal movement over a period of generations.
31 Beier, P. and S. Loe. 1992. A checklist for evaluating impacts to wildlife movement corridors. Wildlife Society Bulletin 20: 434-440.
32 Beier, P. and S. Loe. 1992. A checklist for evaluating impacts to wildlife movement corridors. Wildlife Society Bulletin 20: 434-440.
2.3.6 DESCRIPTION OF THE MSHCP CONSERVATION AREA
2.3.6.1. The MSHCP Plan Map

2.3.7 PERMITTED ACTIVITIES/ALLOCABLE USES
2.3.7.1. Covered Activities Outside Criteria Area
2.3.7.2. Agriculture
2.3.7.3. Covered Activities Within Existing Public/Quasi-Public Lands Area Existing Roads Within Public/Quasi-Public Lands
| Table 2-4 Existing Roads Within Public/Quasi-Public Lands | |
|---|---|
| Facility Type | Length (Miles)* Public/Quasi Public |
| Interstate & Freeways | 6.5 |
| State Highways | 2.9 |
| County Maintained - Paved | 7.0 |
| County Maintained - Unpaved | 0.5 |
| CSA/CSD Maintained | 2.3 |
| City Maintained | 9.2 |
| Subtotal | 128.4 |
| Roadways Maintained by Others** | 259.5 |
| Plan Area Total | 387.90 |
| * Totals may not precisely add due to rounding ** Limited coverage afforded, subject to submittal of application for Certificate of Inclusion. CSA/CSD Maintained roads derived from selecting County Roads within CSA Boundaries. Roadways Maintained by Others derived from selecting road types other than those specified above. | |
33 Roads not maintained by a city or the County are generally maintained by the adjacent property owners, either individually or collectively.
| Table 2-5 Hemet to Corona/Lake Elsinore Corridor Impacts Within Public/Quasi Public Lands | |
|---|---|
| Existing Public/Quasi-Public Lands | Acreage Impacted |
| Lake Mathews/Estelle Mountain | 170-230 |
| San Jacinto/Lake Perris | 0-45 |
| Steele Peak | 0 |
| TOTAL | 170-275 |
2.3.7.4. Covered Activities Inside Criteria Area Public and Private Development Consistent with MSHCP Criteria
| Table 2-6 Existing Roadways Permitted to Remain in the Criteria Area | |
|---|---|
| Facility Type | Length (Miles) Criteria Area |
| Interstate & Freeways | 70 |
| State Highways | 93 |
| County Maintained - Paved | 123 |
| County Maintained - Unpaved | 33 |
| CSA/CSD Maintained | 64 |
| City Maintained | 333 |
| Subtotal | 716 |
| Roadways Maintained by Others* | 677 |
| Plan Area Total | 1,393 |
| * Limited coverage afforded, subject to submittal of application for Certificate of Inclusion. CSA/CSD Maintained roads derived from selecting County Roads within CSA Boundaries. Roadways Maintained by Others derived from selecting road types other than those specified above. | |
34 Roadways not maintained by a city or the County are generally maintained by the adjacent property owners, either individually or collectively.
| Table 2-7 Potential Flood Control Projects Within the MSHCP Criteria Area | |
|---|---|
| Project Description | Project Location |
| Flood Control Improvements | In Prado Basin |
| Arroyo del Toro Channel | Lake Elsinore Outlet Channel to Cabern Avenue |
| Day Creek Channel Stage 6 | Lucretia Street to Limonite Avenue |
| Gavilan Hills/Smith Road | Southwesterly of Smith and Cajalco Roads |
| Murrieta Creek Channel | Gage Station to Tenaja Road |
| Murrieta Creek MDP- Line A | Del Rio Road to Front Street |
| Murrieta Creek MDP- Line D | Murrieta Creek to Madison Avenue |
| Perris Valley Channel | Ramona Expressway to San Jacinto River |
| San Jacinto River Stage 3 | Ramona Expressway to Railroad Canyon |
| San Jacinto River Stage 4 | 4000ft NW of Sanderson Avenue to Corps Levee SE of State Street |
| Warm Springs Channel | Madison Avenue westerly to existing Stage 2 channel near Jefferson Avenue |
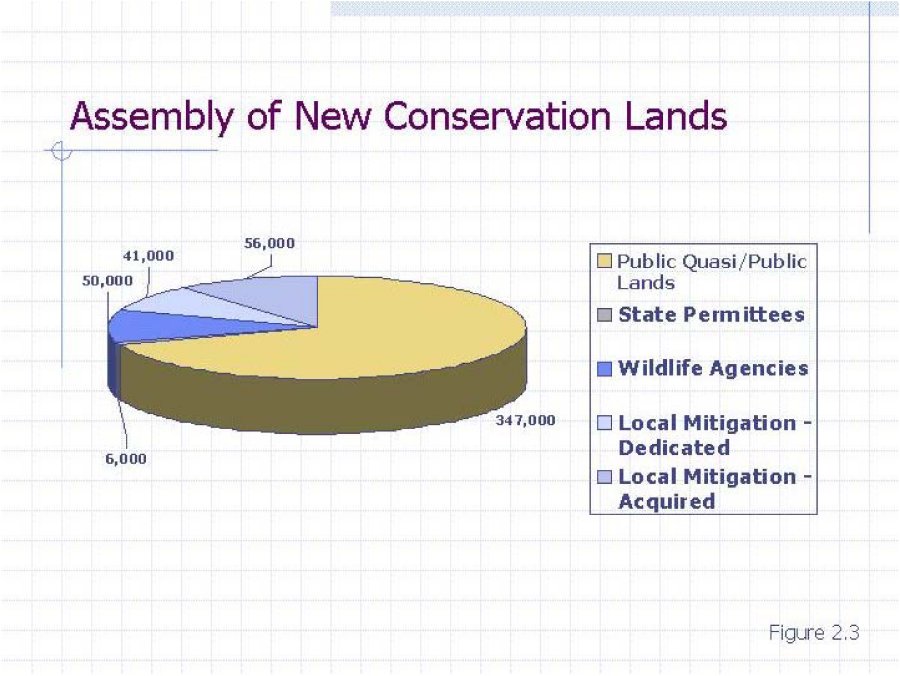
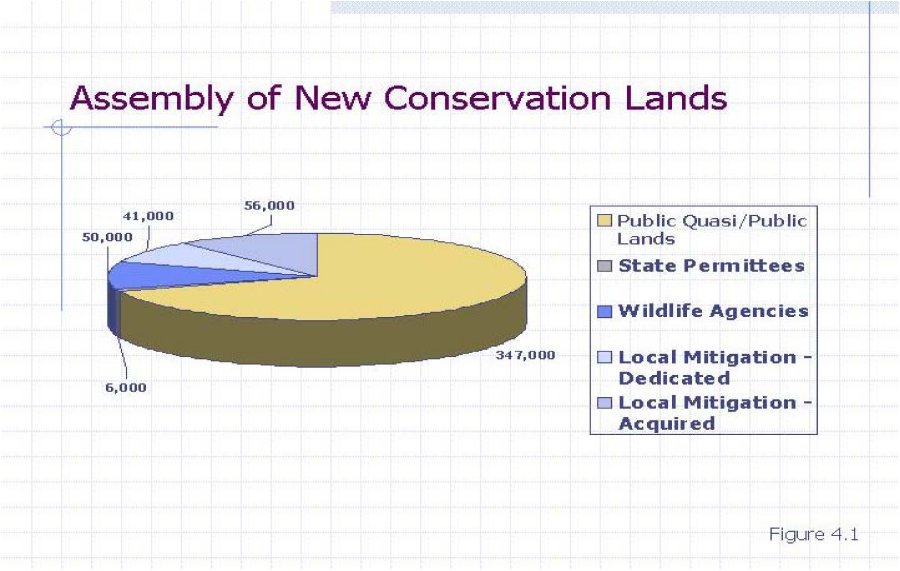
2.4. MSHCP CONSERVATION AREA ASSEMBLY

| Table 2-8 Assembly of Additional Conservation Area Land | |||
|---|---|---|---|
| New Conservation Total (Acres) | New Conservation Counted as Mitigation (Acres) | Local Management & Monitoring Obligation (Acres) | |
| State and Federal Acquisition* | 6,000 | 6,000 | |
| Local Acquisition | 6,000 | 6,000 | 6,000 |
| Sub-total Acquisition | 112,000 | 62,000 | 6,000 |
| Conservation Through Development Review | 41,000 | 41,000 | 41,000 |
| Total Additional Conservation | 153,000 | 103,000 | 97,000 |
| Existing Local Lands | 5,000 | ||
| Total Additional and Existing | 152,000 | ||
| * Includes mitigation provided by DPR and Caltrans permitted projects | |||
35 The HANS Process is presented in detail in Section 6.1.1 of Volume I of the MSHCP.
| Table 2-9 Local Implementation Plan | |
|---|---|
| Implementation Approach | Anticipated Conservation |
| Development Review | 41,000 |
| Local Permittees' Acquisition of Additional Conservation Area Lands | 6,000 |
| Caltrans Acquisition of Additional Conservation Area Lands | 3,000 |
| State Parks Acquisition | 3,000 |
| Total | 103,000 |
2.4.1 DEVELOPMENT REVIEW
2.4.2 LOCAL PERMITTEES' ACQUISITION OF ADDITIONAL CONSERVATION LANDS
2.4.3 CALTRANS ACQUISITION OF ADDITIONAL CONSERVATION LANDS
2.4.4 STATE PARKS ACQUISITION OF ADDITIONAL CONSERVATION LANDS
2.5. RELATIONSHIPS AND DIFFERENCES BETWEEN RCIP COMPONENTS
3. EXISTING ENVIRONMENTAL, TRANSPORTATION, AND BIOLOGICAL SETTING OF THE MSHCP PLAN AREA
3.1. ENVIRONMENTAL SETTING
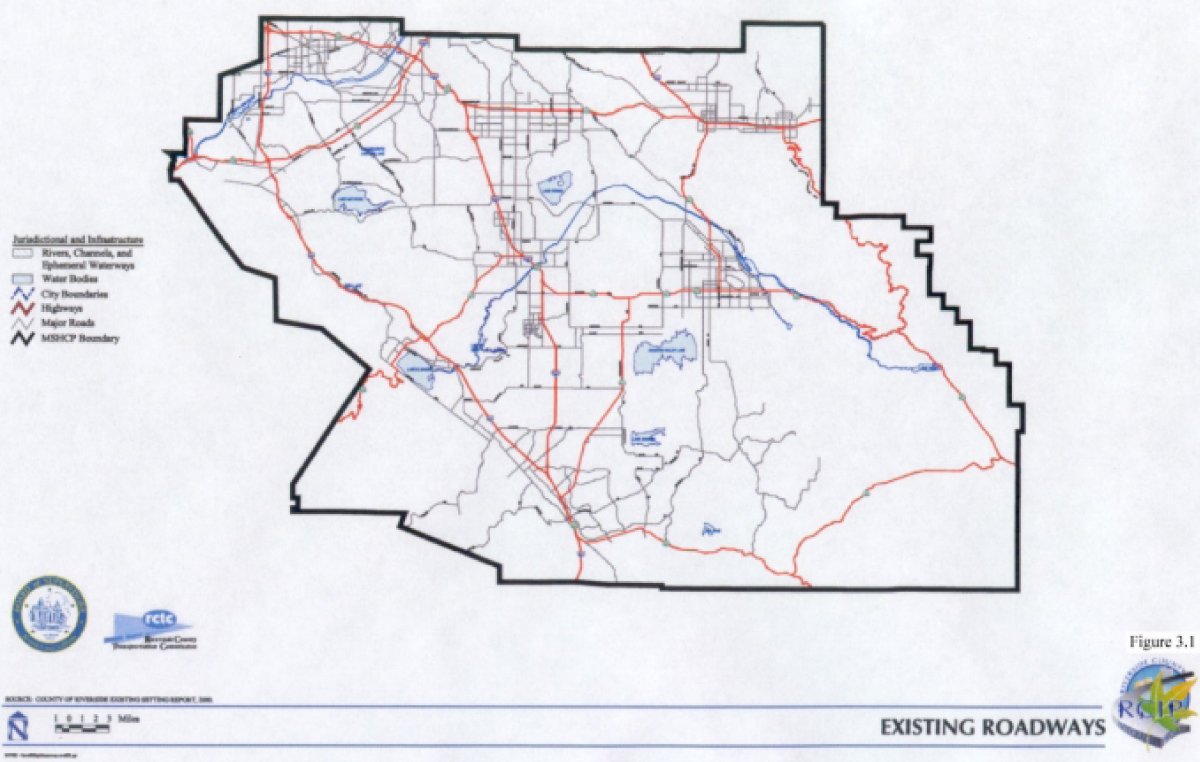
3.2. TRANSPORTATION SETTING
3.2.1 EXISTING STREET AND HIGHWAY SYSTEM
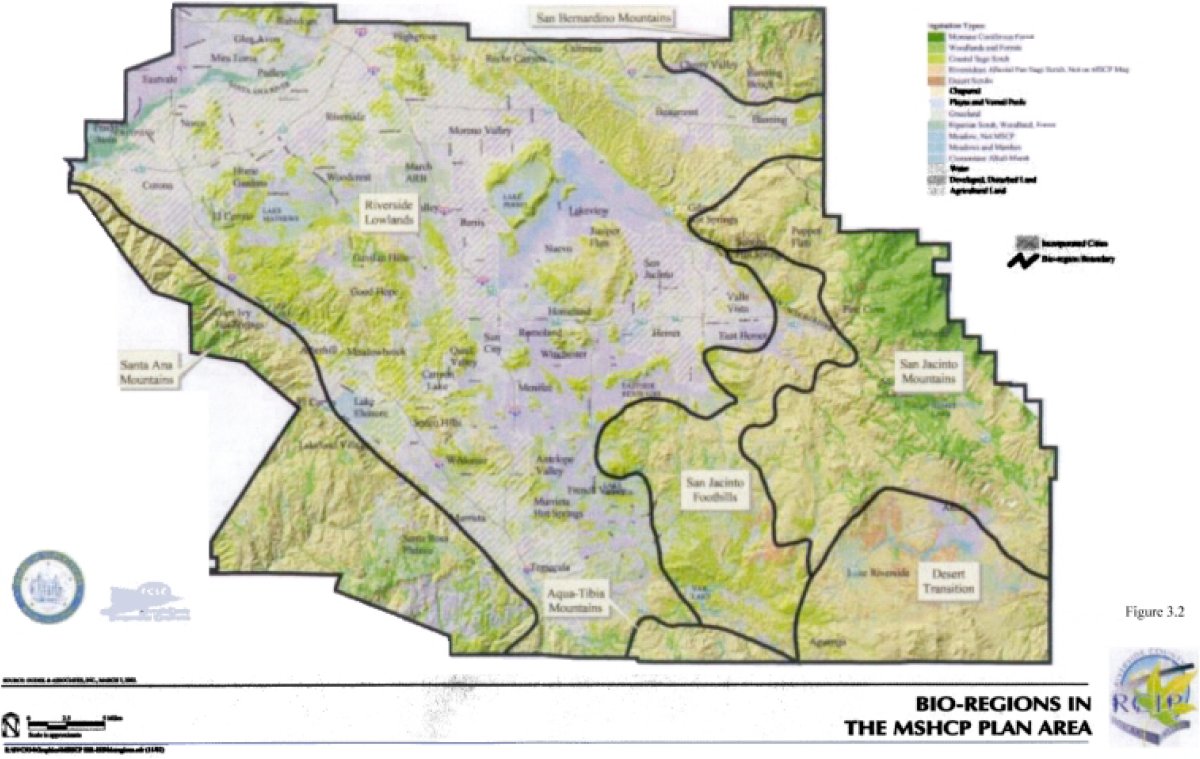
3.3. BIOLOGICAL SETTING
3.3.1 BIOREGIONS
36 Volume II is the MSHCP reference document.
3.3.2 VEGETATION COMMUNITIES
37 Reference is made to Section C of the MSHCP Reference Document (MSHCP Volume II) for detailed habitat accounts describing the biogeography, range and distribution, vegetation characteristics, species composition, physical environment, ecosystem processes, community relationships, and threats for each vegetation community within the Plan Area.
38 Vernal pools are ephemeral wetlands that form in shallow depressions underlain by a substrate near the surface that restricts the downward percolation of water. Depressions in the landscape fill with rainwater and runoff from adjacent areas during the winter and may remain inundated until spring or early summer, sometimes drying more than once during the wet season. Smaller pools can fill and dry, and larger pools can hold water longer and may in the deeper portions support species that are more representative of freshwater marshes.
39 Open water includes inland depressions, ponds, lakes, reservoirs, and stream channels containing standing water and often occurs in conjunction with riparian and upland vegetation communities. Depth may vary from hundreds of feet to a few inches.
4. MITIGATION FEE JUSTIFICATION
4.1. HISTORICAL CONTEXT FOR MITIGATION FEES
40 California Government Code, Section 66000.
4.2. REQUIREMENTS TO ESTABLISH A DEVELOPMENT IMPACT MITIGATION FEE
4.3. THE FEE AS ONE COMPONENT OF THE OVERALL FINANCING PROGRAM
4.4. PURPOSE OF THE FEE (GOVERNMENT CODE SECTION 66001(A)(1))
41 Hearing Draft General Plan, April 2002.
42 WRCOG City General Plan land use database, October 2000.
"The [Western Riverside County MSHCP Program] plan is the largest HCP ever attempted and covers multiple species and multiple habitats within multiple jurisdictions. The plan covers a diverse landscape from urban cities to undeveloped foothills and mountain forests. In addition to the presence of multiple habitats, the plan stretches across the Santa Ana Mountains, Riverside Lowlands, San Jacinto Foothills, San Jacinto Mountains, Aqua Tibia Mountains, Desert Transition and San Bernardino Mountains bio-regions."43
43 Draft MSHCP, November 15, 2002, Volume 1 - The Plan, page 1-1 and Volume 4 - EIR/EIS, page 1.1-7.
44 Draft MSHCP, November 2002, Volume 1, page 3-4.
"To use, and the use of, methods and procedures within the MSHCP Conservation Area and within the Plan Area as set forth in the MSHCP Plan, that are necessary to bring any listed species to the point at which the measures provided pursuant to FESA and the California Fish and Game Code are no longer necessary. However, Permittees will have no duty to enhance, restore or revegetate MSHCP Conservation Area lands unless required by the MSHCP Plan or agreed to through implementation of the Plan."
45 County of Riverside, General Plan Public Hearing Draft, Multipurpose Open Space Element, April 2002.
46 City of Perris, General Plan Conservation/Open Space/Recreation Element, October 1991.
47 City of Hemet, General Plan Resource Management, August 1993.
48 City of Riverside, General Plan Resource Conservation, September 1994.
49 City of Norco, General Plan Conservation Element, February 2002.
50 City of Calimesa, General Plan Resources Management Element, April 1994.
51 City of Temecula, General Plan Open Space/Conservation Element, November 1993.
52 City of Corona, General Plan Conservation Element, 1978/79.
53 City of Riverside, General Plan Resource Conservation, September 1994.
54 City of Temecula, General Plan Open Space/Conservation Element, November 1993.
55 City of Norco, General Plan Conservation Element, February 2002.
56 City of Murrieta, General Plan Conservation and Open Space Element, June 1994.
57 City of Hemet, General Plan Resource Management, August 1993.
58 City of Murrieta, General Plan Conservation and Open Space Element, June 1994.
59 City of Riverside, General Plan Resource Conservation, September 1994.
60 City of Banning, General Plan Open Space and Habitat Conservation Element, May 1986.
61 City of Beaumont, General Plan Natural Resources and Conservation Element, May 1993.
62 City of Beaumont, General Plan Natural Resources and Conservation Element, May 1993.
63 City of Calimesa, Resources Management Element, April 1994.
64 City of Calimesa, General Plan Resources Management Element, April 1994.
65 County of Riverside General Plan Public Hearing Draft, Multipurpose Open Space Element, April 2002.
66 County of Riverside, General Plan Public Hearing Draft, Multipurpose Open Space Element, April 2002.
4.5. THE USE TO WHICH THE FEE IS TO BE PUT (GOVERNMENT CODE SECTION 66001(a)(2))
67 County of Riverside, General Plan Public Hearing Draft, Multipurpose Open space Element, April 2002.
68 Draft MSHCP, November 15, 2002, Volume 4 - EIR/EIS, page 1.2-5.
4.6. DETERMINE THAT THERE IS A REASONABLE RELATIONSHIP BETWEEN THE FEE'S USE AND THE TYPE OF DEVELOPMENT PROJECT UPON WHICH THE FEE IS IMPOSED (BENEFIT RELATIONSHIP) (GOVERNMENT CODE SECTION 66001(A)(3))
69 Beier, P. and S. Loe. 1992. A checklist for evaluating impacts to wildlife movement corridors. Wildlife Society Bulletin 20: 434-440.
4.7. DETERMINE HOW THERE IS A REASONABLE RELATIONSHIP BETWEEN THE NEED FOR THE PUBLIC FACILITY AND THE TYPE OF DEVELOPMENT PROJECT UPON WHICH THE FEE IS IMPOSED (IMPACT RELATIONSHIP) (GOVERNMENT CODE SECTION 66001(a)(4))
70 With, K. and A. King. 1999. Extinction Thresholds for Species in Fractal Landscapes. Conservation Biology: 314-326.
4.8. THE RELATIONSHIP BETWEEN THE AMOUNT OF THE FEE AND THE COST OF THE PUBLIC FACILITY (HABITAT ACQUISITION) ATTRIBUTABLE TO THE DEVELOPMENT UPON WHICH THE FEE IS IMPOSED ("ROUGH PROPORTIONALITY" RELATIONSHIP) (GOVERNMENT CODE 66001(a)
4.8.1 LOCAL ACQUISITION AND OTHER APPROPRIATE COSTS
71 Less already acquired land as discussed in Section 4.8.1.1
72 Draft MSHCP, Volume 1, November 2002, page 8-15.
73 The four General Plan Land Use Foundation Elements are: Community Development, Rural, Agricultural, and Open Space.
4.8.1.1. Existing Local Acquisition to the MSHCP
4.8.2 PROBABLE OVERALL VALUE METHODOLOGY
74 This number may be updated and the LDMF recalculated accordingly prior to adoption of the Ordinance implementing the LDMF.
75 Foundation Components as identified in the Hearing Draft General Plan dated April 5, 2002.
76 For the probable valuation analysis, the Rural and Agricultural components were combined.
4.8.3 ELIGIBLE USES OF THE LDMF
4.8.3.1. Land Acquisition Costs
| Table 4-1 Median Conservation Acres by Area Plan | ||||
|---|---|---|---|---|
| Area Plan | Acreage Range/[1] | Portion of Conserved Area/[3] | ||
| Low | High | Median/[2] | ||
| Eastvale | 150 | 290 | 220 | 0.14% |
| Elsinore | 11,560 | 18,860 | 15,210 | 9.54% |
| Harvest Valley/Winchester | 410 | 630 | 20 | 0.33% |
| Highgrove | 310 | 610 | 460 | 0.29% |
| Jurupa | 930 | 1,850 | 1,390 | 0.87% |
| Lake Mathews/Woodcrest | 3,090 | ,610 | 4,350 | 2.73% |
| Lakeview/Nuevo | 6,700 | 10,260 | 8,480 | .32% |
| March | 0 | 0 | 0 | 0.00% |
| Mead Valley | 1,910 | 3,650 | 2,780 | 1.74% |
| REMAP | 35,060 | 65,100 | 0,080 | 31.42% |
| Reche Canyon/Badlands | 9,850 | 16,420 | 13,135 | 8.24% |
| San Jacinto Valley | 11,480 | 19,820 | 15,650 | 9.82% |
| Southwest Area | 20,320 | 39,020 | 29,670 | 18.61% |
| Sun City/Menifee | 1,120 | 1,580 | 1,350 | 0.85% |
| Temescal Canyon | 3,350 | ,970 | 4,660 | 2.92% |
| The Pass | 8,400 | 14,120 | 11,260 | 7.06% |
| Cities of Riverside and Norco | 110 | 270 | 190 | 0.12% |
| Totals | 114,750 | 204,060 | 159,405 | 100.00% |
| Notes: [1] Low and high acreage ranges per Draft MSHCP, Volume 1, November 2002, Table 4-2. [2] Statistical Median [3] Calculated using the Median for each Area Plan | ||||
| Table 4-2 Allocation of Local Acquisitions by Area Plan | ||
|---|---|---|
| Area Plan | Portion of Conserved Area/[3] | |
| Eastvale | 0.14% | 74 acres |
| Elsinore | 9.54% | ,109 acres |
| Harvest Valley/Winchester | 0.33% | 175 acres |
| Highgrove | 0.29% | 155 acres |
| Jurupa | 0.87% | 467 acres |
| Lake Mathews/Woodcrest | 2.73% | 1,461 acres |
| Lakeview/Nuevo | .32% | 2,849 acres |
| March | 0.00% | 0 acres |
| Mead Valley | 1.74% | 934 acres |
| REMAP | 31.42% | 16,822 acres |
| Reche Canyon/Badlands | 8.24% | 4,412 acres |
| San Jacinto Valley | 9.82% | ,257 acres |
| Southwest Area | 18.61% | 9,966 acres |
| Sun City/Menifee | 0.85% | 453 acres |
| Temescal Canyon | 2.92% | 1,565 acres |
| The Pass | 7.06% | 3,782 acres |
| Cities of Riverside and Norco | 0.12% | 64 acres |
| Totals | 100.00% | 53,546 |
| Notes: Percentages from Table 4-1 | ||
77 A report summarizing the amount of privately owned property by land use type and Area Plan is included in Appendix C.
| Table 4-3 MSHCP Criteria Area by Area Plan and General Plan Foundation Component/[1] | |||||
|---|---|---|---|---|---|
| Foundation Component (Acres) | |||||
| Area Plan | Community Development | Rural | Agricultural | Open Space | Total/[2] |
| Eastvale | 45 | 0 | 0 | 486 | 30 |
| Elsinore | 8,932 | ,122 | 0 | 7,576 | 21,629 |
| Harvest Valley/Winchester | 37 | 487 | 0 | 185 | 708 |
| Highgrove | 219 | 1,030 | 2 | 31 | 1,283 |
| Jurupa | 1,636 | 8 | 0 | 1,715 | 3,360 |
| Lake Mathews/Woodcrest | 1,083 | 6,285 | 0 | 1,497 | 8,865 |
| Lakeview/Nuevo | 4,294 | 6,737 | 1,601 | 1,013 | 13,645 |
| March | 0 | 0 | 0 | 0 | 0 |
| Mead Valley | 2,579 | 2,889 | 0 | 419 | ,886 |
| Reche Canyon/Badlands | 2,641 | ,461 | 287 | 13,314 | 21,703 |
| REMAP | 788 | 3,301 | 2,537 | 13,272 | 69,897 |
| San Jacinto Valley | ,785 | 7,716 | 4,180 | 10,642 | 28,322 |
| SWAP | 10,072 | 33,152 | 1,745 | 9,866 | 4,836 |
| Sun City/Menifee | 13 | 1,915 | 0 | 0 | 1,928 |
| Temescal | 2,732 | 1,362 | 206 | 3,266 | 7,565 |
| The Pass | 9,193 | 8,955 | 289 | 2,969 | 21,407 |
| Cities of Riverside/Norco | 155 | 0 | 41 | 257 | 453 |
| Total | 50,205 | 134,419 | 10,888 | 66,505 | 262,018 |
| Notes: [1] Foundation Components per the Hearing Draft General Plan, April 2002 [2] Does not include public/quasi public or Indian lands. | |||||
| Table 4-4 MSHCP Criteria Area General Plan Foundation Component Expressed as a Percentage of Area Plan/[1] | |||||
|---|---|---|---|---|---|
| Foundation Component (Percentages) | |||||
| Area Plan | Community Development | Rural | Agricultural | Open Space | Total for Area Plan |
| Eastvale | 8.5% | 0.0% | 0.0% | 91.5% | 100.0% |
| Elsinore | 41.3% | 23.7% | 0.0% | 35.0% | 100.0% |
| Harvest Valley/Winchester | .2% | 68.8% | 0.0% | 26.1% | 100.0% |
| Highgrove | 17.1% | 80.3% | 0.2% | 2.4% | 100.0% |
| Jurupa | 48.7% | 0.2% | 0.0% | 1.1% | 100.0% |
| Lake Mathews/Woodcrest | 12.2% | 70.9% | 0.0% | 16.9% | 100.0% |
| Lakeview/Nuevo | 31.5% | 49.4% | 11.7% | 7.4% | 100.0% |
| March | 0.0% | 0.0% | 0.0% | 0.0% | 0.0% |
| Mead Valley | 43.8% | 49.1% | 0.0% | 7.1% | 100.0% |
| Reche Canyon/Badlands | 12.2% | 25.2% | 1.3% | 61.3% | 100.0% |
| REMAP | 1.1% | 76.3% | 3.6% | 19.0% | 100.0% |
| San Jacinto Valley | 20.4% | 27.2% | 14.8% | 37.6% | 100.0% |
| SWAP | 18.4% | 60.5% | 3.2% | 18.0% | 100.0% |
| Sun City/Menifee | 0.7% | 99.3% | 0.0% | 0.0% | 100.0% |
| Temescal | 36.1% | 18.0% | 2.7% | 43.2% | 100.0% |
| The Pass | 42.9% | 41.8% | 1.4% | 13.9% | 100.0% |
| Cities of Riverside/Norco | 34.2% | 0.0% | 9.1% | 6.7% | 100.0% |
| Notes: [1] Foundation Components per the Hearing Draft General Plan, April 2002 | |||||
| Table 4-5 Acres of Habitat to be Acquired with LDMF Foundation Component and Area Plan/[1] | |||||
|---|---|---|---|---|---|
| Acres Habitat to be Acquired with LDMF | |||||
| Area Plan | Community Development | Rural | Agricultural | Open Space | Total for Area Plan |
| Eastvale | 6 | 0 | 0 | 68 | 74 |
| Elsinore | 2,110 | 1,210 | 0 | 1,789 | ,109 |
| Harvest Valley/Winchester | 9 | 120 | 0 | 46 | 175 |
| Highgrove | 26 | 124 | 0.3 | 4 | 155 |
| Jurupa | 227 | 1 | 0 | 238 | 467 |
| Lake Mathews/Woodcrest | 179 | 1,036 | 0 | 247 | 1,461 |
| Lakeview/Nuevo | 896 | 1,406 | 334 | 211 | 2,849 |
| March | 0 | 0 | 0 | 0 | 0 |
| Mead Valley | 409 | 458 | 0 | 66 | 934 |
| Reche Canyon/Badlands | 2,047 | 4,233 | 222 | 10,320 | 16,822 |
| REMAP | 0 | 3,365 | 160 | 838 | 4,412 |
| San Jacinto Valley | 1,074 | 1,432 | 776 | 1,975 | ,257 |
| SWAP | 1,831 | 6,025 | 317 | 1,793 | 9,966 |
| Sun City/Menifee | 3 | 450 | 0 | 0 | 453 |
| Temescal | 65 | 282 | 43 | 676 | 1,565 |
| The Pass | 1,624 | 1,582 | 1 | 25 | 3,782 |
| Cities of Riverside/Norco | 22 | 0 | 6 | 36 | 64 |
| Totals | 11,079 | 21,726 | 1,909 | 18,832 | 3,546 |
| Portion of Total | 20.7% | 40.6% | 3.6% | 35.2% | 100.0% |
| Notes: [1] Foundation Components per the Hearing Draft General Plan, April 2002 | |||||
| Table 4-6 Projected Acquisition Cost | |||||
|---|---|---|---|---|---|
| Area Plan | Community Development | Rural | Agricultural | Open Space | Total for Area Plan |
| Eastvale | $437,914 | $0 | $0 | $676,447 | $1,114,360 |
| Elsinore | $84,391,410 | $12,099,582 | $0 | $14,315,784 | $110,806,777 |
| Harvest Valley/Winchester | $362,075 | $1,200,915 | $0 | $227,653 | $1,790,644 |
| Highgrove | $1,584,203 | $2,481,171 | $5,779 | $37,685 | $4,108,838 |
| Jurupa | $9,095,963 | $17,303 | $0 | $1,191,823 | $10,305,089 |
| Lake Mathews/Woodcrest | $5,357,478 | $10,359,571 | $0 | $1,233,380 | $16,950,429 |
| Lakeview/Nuevo | $26,894,546 | $14,064,686 | $3,341,647 | $1,057,064 | $45,357,943 |
| March | $0 | $0 | $0 | $0 | $0 |
| Mead Valley | $12,273,443 | $4,582,473 | $0 | $0 | $16,855,916 |
| Reche Canyon/Badlands | $81,886,155 | $63,498,123 | $3,332,216 | $51,599,734 | $200,316,227 |
| REMAP | $994,584 | $16,822,738 | $800,856 | $2,094,380 | $20,712,557 |
| San Jacinto Valley | $42,949,765 | $14,321,105 | $7,758,696 | $7,901,174 | $72,930,740 |
| SWAP | $91,534,287 | $120,508,936 | $6,344,623 | $17,931,356 | $236,319,202 |
| Sun City/Menifee | $124,203 | $18,015,028 | $0 | $0 | $18,139,230 |
| Temescal | $28,268,264 | $14,087,577 | $2,126,017 | $6,757,112 | $51,238,970 |
| The Pass | $48,731,354 | $15,823,082 | $511,169 | $2,622,809 | $67,688,414 |
| Cities of Riverside/Norco | $1,747,037 | $0 | $57,765 | $289,670 | $2,094,472 |
| Totals | $436,632,681 | $307,882,289 | $24,278,766 | $107,936,072 | $876,729,808 |
4.8.3.2. Other Appropriate Costs
4.8.3.3. Total Cost to be Financed Through Mitigation Fee Program
4.8.4 AREA OVER WHICH THE LDMF IS TO BE IMPOSED (WHY A REGIONAL FEE?)
78 Source: County of Riverside Transportation and Land Management Agency, January 21, 2003.
79 Program Administration
80 With, K. and A. King. 1999. Extinction Thresholds for Species in Fractal Landscapes. Conservation Biology: 314-326.
4.8.5 DEVELOPMENT HORIZON USED IN THE NEXUS REPORT
4.8.6 EXISTING DEFICIENCIES
4.8.7 CALCULATION OF MITIGATION FEE AMOUNTS
4.8.7.1. What Type of Fee Methodology is Appropriate for the LDMF?
4.8.7 CALCULATION OF MITIGATION FEE AMOUNTS
4.8.7.1. What Type of Fee Methodology is Appropriate for the LDMF?
4.8.7.2. Gross Acreage Based Fee Methodology
81 Refer to Section 7.3.2 of Volume I and page 4.1-32 of Volume IV of the Draft MSHCP.
82 Volume IV, Draft MSHCP, page 4.1-32.
83 Volume I of the Draft MSHCP, November 2002, page 8-9.
84 Rural land use designations as used in the Nexus Report are per the Hearing Draft General Plan (Table
LU-3, page LU-36) and include: (1) Rural Residential, which has a minimum lot size of 5 acres, (2)
Agriculture, Rural Mountainous, and Rural Desert, which have a minimum lot size of 10 acres, and (3)
Open Space-Rural, which have a minimum lot size of 5 acres.
85 Volume I of the Draft MSHCP, November 2002, page 8-9.
86 Very low density residential as used in the Nexus Report refers to the Very Low Density Residnetial land use designation per the Hearing Draft General Plan (Table LU-3, page LU-36), which allows lot sizes ranging from 0.5 - 2.5 acres.
87 Extrapolated for 25 years based on 80% expected development in a 30 year period per Volume I of the Draft MSHCP, November 23002, page 8-9.
| Table 4-7 Local Development Mitigation Fee Amounts Acreage Methodology | |||
|---|---|---|---|
| Land Use | Gross Acres at Buildout | Projected Developed Acres in 25 Years | Per Acre Fee - Acquisition and Administration |
| [1] | [2] | [3] | |
| Rural (Includes: rural residential, rural mountainous, rural desert and open space rural land use designations) | 369,824 | 4,161* | $9,492 |
| Very Low Density Residential | 56,362 | 11,273* | $9,492 |
| Residential (Includes low, medium, medium high, high, and very high residential designations) | 96,112 | 48,058 | $9,492 |
| Commercial (Includes retail, tourist and office commercial land uses designations) | 13,776 | 6,888 | $9,492 |
| Industrial and Business Park (Includes light industrial, high industrial, and business park land use designations) | 26,590 | 13,296 | $9,492 |
| Community Center | 2,357.0 | 1,179 | $9,492 |
| City Mixed-Use and City-Special Planning Area | 21,345.0 | 10,673 | $9,492 |
| Total | 586,366.0 | 95,528 | |
| Costs to be Financed Through LDMF | $906,729,808 | ||
| Fee Per Acre | $9,492 | ||
| Absorption of Rural Land Use in 25 years: 30% (Source: Volume I, Draft MSHCP) Absorption of All Other Land Uses in 25 Years: 67% (Source: Volume I, Draft MSHCP) Portion of Acreage Assumed Developable 75% Average Lot Size for Rural Land Use: 10.0 acres *Acreage assuming only 0.5 acre of residential lot is subject to Local Development Mitigation | |||
4.8.7.3. Density Methodology
88 County of Riverside Hearing Draft General Plan, April 2002, Table LU-3.
89 County of Riverside Hearing Draft General Plan, April 2002, Table LU-3
90 0.4 DWs = 4.2 DU/acre divided by 11.0 DU/acre.
| Table 4-8 Local Development Mitigation Fee Amounts Density Based Methodology 1 | |||||||
|---|---|---|---|---|---|---|---|
| Land Use Category | Density | Density Weight Factors | Expected Dwelling Units in 25 Years | Expected Density Weight Factors in 25 Years [1]*[2] | Proposed Fee per Dwelling Unit or Acre- Acquisition and Administration | ||
| Low End Density (DUs/Acre) | High End Density (DUs/Acre) | Density Mid-Point (DUs/Acre) | |||||
| [1] | [2] | [3] | [4] | ||||
| Rural Residential | NA | NA | NA | 1.0 | 6,972 | 6,972 | $2,414 |
| Residential, density between 0.4 to 8.0 dwelling units per acre | 0.4 | 8 | 4.20 | 1.0 | 290,201 | 290,201 | $2,414 |
| Residential, density between 8.1 and 14.0 dwelling units per acre | 8 | 14 | 11.00 | 0.4 | 11,620 | 4,648 | $965 |
| Total | 308,793 | 301,821 | |||||
| Expected New Developed Acres in 25 Years | |||||||
| High and Very High Density Residential, density greater than 14.1 dwelling units per acre | Greater than 14.1 dwelling units per acre | 3.4 | 1,535 | 5,219 | $8,208 | ||
| Commercial | NA | NA | NA | 3.4 | 6,888 | 23,419 | $8,208 |
| Industrial | NA | NA | NA | 3.4 | 13,296 | 45,206 | $8,208 |
| 21,719 | 73,844 | ||||||
| TOTAL EBUs in 25 Years | 375,665 | ||||||
| Cost to be Financed Through LDMF | $906,729,808 | ||||||
| Cost per DW unit | $2,414 | ||||||
91 Volume I of the Draft MSHCP, November 2002, page 8-9.
92 Extrapolated for 25 years based on 80% expected development in a 30 year period.
| Table 4-9 25 Year Development Projections for the EBU Based LDMF | ||||||
|---|---|---|---|---|---|---|
| Land Use Category | Gross Acres at Buildout | Developed Acres in 25 Years | Density Midpoint | DTA Projected Dwelling Units in 25 Years | Portion of Projected Dwelling Units | Allocation of Dwelling Units Projected for CETAP Modeling 332,000 projected units |
| [1] | [2] | [3] | [4] | [5] | [6] | |
| Rural Residential | 132,572 | 46,400 | 0.1 | 4,640 | 1.22% | 4,050 |
| Rural Mountainous | 148,453 | 51,959 | 0.1 | 2,598 | 0.68% | 2,258 |
| Rural Desert | 53 | 19 | 0.1 | 1 | 0.00% | 0 |
| Open Space Rural | 88,746 | 31,061 | 0.025 | 777 | 0.20% | 664 |
| Very Low Residential | 56,362 | 37,577.0 | 1.2 | 45,092 | 11.84% | 39,309 |
| Low Residential | 55,402 | 36,937.0 | 3.5 | 129,280 | 33.94% | 112,681 |
| Medium Residential | 36,590 | 24,395.0 | 6.5 | 158,568 | 41.63% | 138,211 |
| Medium High Residential | 1,817 | 1,211.0 | 11.0 | 13,321 | 3.50% | 11,620 |
| High Residential | 2,241 | 1,494.0 | 17.0 | 25,398 | 6.67% | 22,144 |
| Very High Residential | 61 | 41.0 | 30.0 | 1,230 | 0.32% | 1,062 |
| Subtotal Residential | 522,297 | 231,094.0 | 380,905 | 100.00% | 332,000 | |
| Commercial | 13,776 | 6,888 | ||||
| Industrial and Business Park | 26,590 | 13,296 | ||||
| Total DTA Units at Density between 0.4-8 du/acre (column [6]) | 332,940 | |||||
| Total Acres at Density between 0.4-8 du/acre (column[2]) | 98,909 | |||||
| Density based on DTA analysis | 3.4 | |||||
4.8.7.4. Equivalent Dwelling Unit - Population and Employee Based
93 United States Census 2000.
94 EDUs for multi-family dwelling = 2.5 people per MFR DU by 3.1 people per SFR DU = 0.8 EDU per MFR unit.
95 Commercial property includes commercial land uses plus residential projects with a densities greater than 14 DU/acre.
96 EDUS for commercial development = 20 employees/acre divided by 3.1 people per SFR DU = 6.5 EDUs/commercial acre.
97 EDUS for industrial development = 10.5 employees/acre divided by 3.1 people per SFR DU = 3.4 EDUs/industrial acre
| Table 4-10 Local Development Mitigation Fee Amounts EDU Methodology, EDUs Based on Population and Employment | |||||
|---|---|---|---|---|---|
| Land Use Category | Population per DU | EDU Assignment | Expected Dwelling Units in 25 Years | Expected EDUs in 25 Years | Proposed Fee - Acquisition and Admin |
| [1] | [2] | [3] | [4] | [5] | |
| Single Family Residential, less than 8.0 dwelling units per acre | 3.1 | 1.0 | 297,173 | 297,173 | $2,231 |
| Multiple Family Residential, density between 8.1 and 14 dwelling units per acre | 2.5 | 0.8 | 11,620 | 9,296 | $1,785 |
| 308,793 | 306,469 | ||||
| Employees per Acre | EDUs/Acre | Expected Developed Acres in 25 Years | |||
| Commercial, Residential Units with densities greater than 14.1 dwelling units per acre | 20.0 | 6.5 | 8,423 | 54,750 | $14,502 |
| Industrial | 10.5 | 3.4 | 13,296 | 45,207 | $7,585 |
| 21,719 | 99,957 | ||||
| TOTAL EDUs in 25 Years | 406,426 | ||||
| Cost to be Financed Through LDMF | $906,729,808 | ||||
| Cost per EDU | $2,231 | ||||
| NOTE: Persons per DU data from United States Census 2000 | |||||
4.8.7.5. Equivalent Benefit Unit Methodology
98 County of Riverside Hearing Draft General Plan, April 2002, Table LU-3.
| Table 4-11 Local Development Mitigation Fee Amounts EBU Methodology, Residential EBU Assignment Based Acreage, Trip Generation, and Population/Employment, Non-Residential EBU based on Residential Density | |||||||||||
|---|---|---|---|---|---|---|---|---|---|---|---|
| Land Use Category | Average Lot Size (DUs/Acre) | Lot Size Factor | Average Trip Ends (Trips/DU) | Avg. Trip End Factor | Average Population (People/DU) | Avg. Pop. Factor | Total All Factors ([2]+[4]+[6]) | Overall EBU Assignment | Expected Dwelling Units in 25 Years | Expected EBUs in 25 Years [8]*[9] | Proposed Fee per Dwelling Unit or Acre- Acquisition and Administration |
| [1] | [2] | [3] | [4] | [5] | [6] | [7] | [8] | [9] | [10] | [11] | |
| Residential, density between 0 to 8.0 dwelling units per acre | 0.224 | 1.00 | 9.570 | 1.00 | 3.266 | 1.00 | 3.000 | 1.0 | 297,173 | 297,173 | $2,354 |
| Residential, density between 8.1 and 14 dwelling units per acre | 0.093 | 0.42 | 6.630 | 0.69 | 2.639 | 0.81 | 1.920 | 0.64 | 11,620 | 7,437 | $1,506 |
| Residential, density greater than 14.1dwelling units per acre | 0.041 | 0.18 | 6.630 | 0.69 | 2.250 | 0.69 | 1.560 | 0.52 | 23,207 | 12,068 | $1,224 |
| Total | 332,000 | 316,678 | |||||||||
| Expected New Developed Acres in 25 Years | |||||||||||
| Commercial | NA | NA | NA | NA | 3.40 | 6,888 | 23,419 | $8,004 | |||
| Industrial | NA | NA | NA | NA | 3.40 | 13,296 | 45,206 | $8,004 | |||
| Total Non-Residential Property | 3.40 | 20,184 | 68,626 | ||||||||
| TOTAL EBUs | 385,304 | ||||||||||
| Cost to be Financed Through LDMF | $906,729,808 | ||||||||||
| Cost per EBU | $2,354 | ||||||||||
5. MSHCP FUNDING/FINANCING OF CONSERVATION AREA ASSEMBLY AND MANAGEMENT
5.1. OVERVIEW OF THE MSHCP FUNDING PLAN99
99 Reference is made to Section 8 of Volume 1 of the Draft MSHCP, November 2002 for a detailed
100 Draft MSHCP, Volume 1, November 2002, page 8-1.
5.2. ESTIMATED PROGRAM COSTS OF MSHCP IMPLEMENTATION
5.2.1 ACQUISITION COSTS FOR ADDITIONAL CONSERVATION AREA LANDS
5.2.2 CONSERVATION AREA MANAGEMENT COSTS
5.2.3 ADAPTIVE MANAGEMENT COSTS
5.2.4 BIOLOGICAL MONITORING COSTS
5.2.5 PROGRAM ADMINISTRATION COSTS
101 Less already acquired lands
102 Supporting data for these costs are documented in Appendix B-02 of Volume I of the Draft MSHCP.
103 Of the $110.99 million reserve management costs for the first 25 years, $87.61 million is needed to
104 Reference is made to Appendix B-05 of Volume 1 of the Draft MSHCP for a cash-flow analysis of the Adaptive Management costs.
105 Section 8.3.3, page 8-5, of Volume 1 of the Draft MSHCP. Reference is made to Section 5.0 of Volume I of the Draft MSHCP for a description of the management and monitoring programs and Appendix B-03 of Volume 1 of the Draft MSHCP for the analysis of staffing requirements and anticipated costs.
106 Draft MSHCP, Volume I, November 2002, Table 8-2.
5.2.6 SUMMARY OF LOCAL PROGRAM COSTS
| Table 5-1 Total Local Program Costs (First 25 years) | ||
|---|---|---|
| Program Element | Amount | Percentage |
| Local Conservation Area Land Acquisition (53,546 acres) | $876,808,000 | 79.93% |
| Conservation Area Management (152,000 acres) | $111,000,000 | 10.12% |
| Adaptive Management (152,000 acres) | $44,500,000 | 4.06% |
| Biological Monitoring (152,000 acres) | $34,700,000 | 3.16% |
| Program Administration | $30,000,000 | 2.73% |
| Total | $1,097,008,000 | 100.00% |
5.3. FUNDING SOURCES FOR PROGRAM COSTS
5.3.1 MITIGATION FOR REGIONAL AND LOCAL INFRASTRUCTURE
5.3.1.1. Transportation Infrastructure Riverside County's ½ Cent Sales Tax for Transportation
5.3.1.2. Regional Infrastructure
5.3.1.3. Regional Utility Projects
107 The Measure A contribution consists of approximately $70 million for CETAP projects and approximately $51 million for "Named Highway Projects" excluding State and Caltrans. Reference is made to Section 13.5 of the IA and Appendix B-07 of Volume I of the Draft MSHCP for further information on the sales tax measure.
108 Based on $5 billion in costs and 5% mitigation. Refer to Appendix B-08 of Volume I of the Draft MSHCP for additional information.
5.3.1.4. Local Public Capital Construction Projects
5.3.2 LANDFILL TIPPING FEES
5.3.3 SUMMARY OF FUNDING SOURCES
| Table 5-3 Mix of Anticipated Revenue Sources | |||
|---|---|---|---|
| Source Anticipated | $ Range | Requirements to Implement | Responsible Party |
| Public Funding Sources: | |||
| Local Roads | $121,000,000 | Approval of Measure A, local agreement on allocation | RCTC/County |
| Regional Infrastructure | $250,000,000 | % of new infrastruction construction | County/other agencies |
| El Sobrante Landfill | $90,000,000 | In place | County |
| TOTAL LOCAL FUNDS | $461,000,000 | ||
109 El Sobrante's contribution assumes 60 million tons of imported waste at $1.50 per ton. Reference is made to Section 8.5.1 and Appendix B-09 of Volume I of the Draft MSHCP.
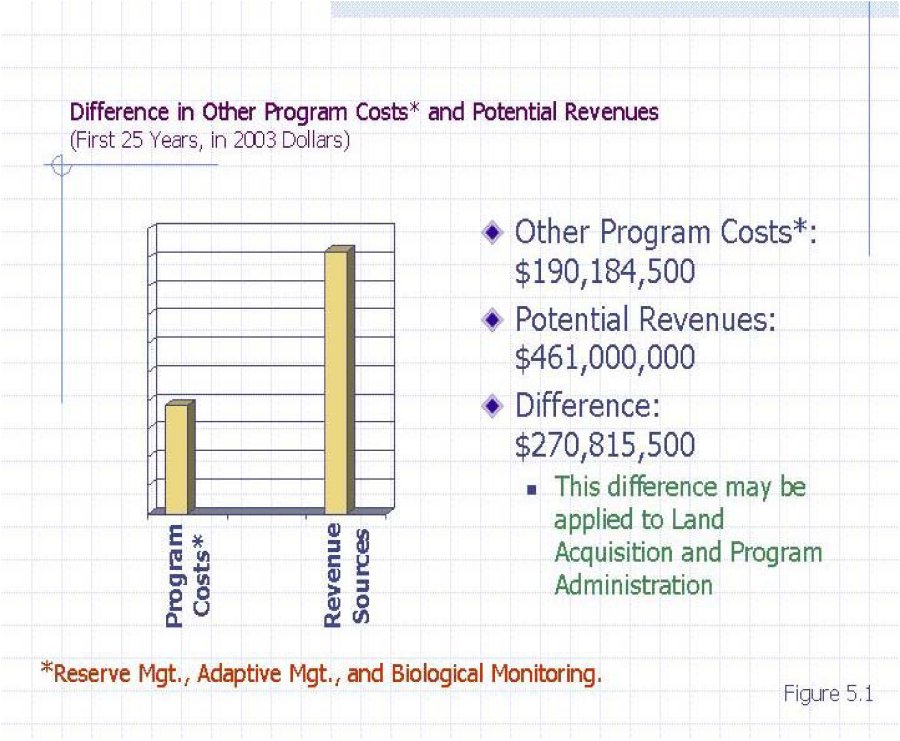
5.4. COMPARISON OF PROGRAM COSTS WITH ANTICIPATED REVENUE SOURCES
| Table 5-4 Other Program Costs versus Expected Revenues - First 25 Years | |
|---|---|
| Other Program Costs | Amount |
| Expected Revenues Amount | Amount |
| Conservation Area Management (152,000 acres) | $110,984,500 |
| Adaptive Management (152,000 acres) | $44,500,000 |
| Biological Monitoring (152,000 acres) | $34,700,000 |
| Total Other Program Costs | $190,184,500 |
| Local Roads | $121,000,000 |
| Regional Infrastructure | $250,000,000 |
| El Sobrante Landfill | $90,000,000 |
| Total Expected Revenues | $461,000,000 |
| Difference | $270,815,500 |
5.5. LOCAL DEVELOPMENT MITIGATION FEES
110 Acquisition and administration costs less $270.8 million as discussed in Section 5.4.
111 $877 million in estimated acquisition costs plus $30 million in administration costs.
| Table 5-5 Acreage Methodology LDMF set to finance Acquisition and Administration Costs Less Available Funds | |||
|---|---|---|---|
| Land Use | Estimated Developed Acres in 25 Years | LDMF per Acre | Funding Gap financed by LDMF per Acre |
| Rural | 4,161 | $6,657 | $27.699.777 |
| Very Low Density Residential | 11,273 | $6,657 | $75,044,361 |
| All Other Residential | 48,058 | $6,657 | $319,922,106 |
| Commercial | 6,888 | $6,657 | $45,853.416 |
| Industrial and Business Park | 13,296 | $6,657 | $88,511.472 |
| Community Center | 1,179 | $6,657 | $7,848,603 |
| City Mixed-Use and Special Planning Area | 10,673 | $6,657 | $71,050,161 |
| Total | 95,528 | $6,657 | $635,929,896* |
| *Difference between Total and $635,914,308 is due to rounding. | |||
| Table 5-6 Density Based Methodology LDMF set to finance Acquisition and Administration Costs Less Available Funds | ||||
|---|---|---|---|---|
| Land Use | EBU Assignment | Expected Units/Developed Acres in 25 Years | LDMF per Unit / Acre | Funding Gap financed by LDMF |
| Rural Residential | 1.0 | 6,972 | $1,693 | $11,803,596 |
| Residential, density 0.4 to 8.0 dwelling units per acre | 1.0 | 290,201 | $1,693 | $491,310,293 |
| Residential, density 8.1 to 14.0 dwelling units per acre | 0.4 | 11,620 | $677 | $7,866,740 |
| Commercial, Residential Units, densities greater than 14.1 dwelling units per acre | 3.4 | 8,423 | $5,756 | $48,482,788 |
| Industrial | 3.4 | 13,296 | $5,756 | $80,855,000 |
| Total | $635,995,193* | |||
| *Difference between Total and $635,914,308 is due to rounding. | ||||
| Table 5-7 EDU Methodology - Population and Employee Based LDMF set to finance Acquisition and Administration Costs Less Available Funds | ||||
|---|---|---|---|---|
| Land Use | EDU Assignment | Expected Units/Developed Acres in 25 Years | LDMF per Unit / Acre | Funding Gap financed by LDMF |
| Single-family Residential (Density less than 8.0 dwelling units per acre) | 1.0 | 297,173 | $1,565 | $465,075,745 |
| Multiple-family Residential (Density 8.1 to 14.0 dwelling units per acre) | 0.8 | 11,620 | $1,252 | $14,548,240 |
| Commercial, Residential Units (Densities greater than 14.1 dwelling units per acre) | 6.5 | 8,423 | $10,173 | $85,682,968 |
| Industrial | 3.4 | 13,296 | $5,321 | $70,748,016 |
| Total | $636,054,969* | |||
| *Difference between Total and $635,914,308 is due to rounding. | ||||
| Table 5-8 EBU Methodology - Average Lot Size, Trip End, and Population per Dwelling Unit Based LDMF set to finance Acquisition and Administration Costs Less Available Funds | ||||
|---|---|---|---|---|
| Land Use | EDU Assignment | Expected Units/Developed Acres in 25 Years | LDMF per Unit / Acre | Funding Gap financed by LDMF |
| Residential, density less than 8.0 dwelling units per acre | 1.00 | 297,173 | $1,651 | $490,632,623 |
| Residential, density 8.1 to 14.0 dwelling units per acre | 0.64 | 11,620 | $1,057 | $12,282,340 |
| Residential, density greater than 14.1 dwelling units per acre | 0.52 | 23,207 | $859 | $19,934,641 |
| Commercial | 3.4 | 6,888 | $5,620 | $38,710,560 |
| Industrial | 3.40 | 13,296 | $5,620 | $74,723,520 |
| Total | $636,283,684* | |||
| *Difference between Total and $635,914,308 is due to rounding. | ||||
6. RECOMMENDATIONS
| Table 6-1 EBU Methodology - Average Lot Size, Trip End, and Population per Dwelling Unit Based LDMF to finance Acquisition and Administration Costs With and Without the Application of Available Funds | ||||
|---|---|---|---|---|
| Land Use | EBU Assignment | LDMF per Unit / Acre Without Application of Available Funds | LDMF per Unit / Acre With Application of Available Funds | |
| [1] | [2] | |||
| Residential, density less than 8.0 dwelling units per acre | 1.00 | $2,354 | $1,651 | |
| Residential, density 8.1 to 14.0 dwelling units per acre | 0.64 | $1,506 | $1,057 | |
| Residential, density greater than 14.1 dwelling units per acre | 0.52 | $1,224 | $859 | |
| Commercial | 3.40 | $8,004 | $5,620 | |
| Industrial | 3.40 | $8,004 | $5,620 | |
| Expected Revenue over 25 Years | $907,002,281 | $636,283,684 | ||
7. OTHER FUNDING ISSUES
7.1. FESA REQUIREMENTS
7.2. ADEQUACY OF FUNDING
| Table 7-1 Rough Proportionality Schedule of Development and Conservation | ||||
|---|---|---|---|---|
| Plan Year | Projected % Developed | Test for "rough proportionality"% of local MSHCP Conservation Area Lands Conserved | ||
| 22% | 22% | |||
| 10 | 43% | 43% | ||
| 15 | 64% | 64% | ||
| 20 | 82% | 82% | ||
| 25 | 100% | 100% | ||
7.3. LONG-TERM FINANCING FOR MANAGEMENT
112 Draft MSHCP, Volume 1, November 2002, page 8-22.